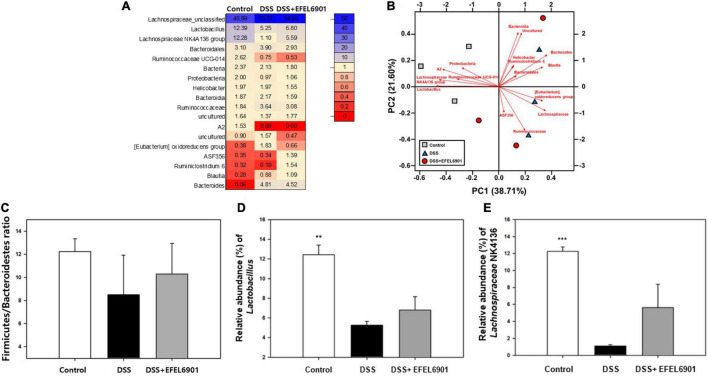
FIGURE 7.
Bacterial taxonomic compositions in DSS-induced colitis mice after oral administration of Limosilactobacillus reuteri EFEL6901. (A) The differences heatmap of microbial abundance at genus level. (B) Biplot of the principal components analysis (PCA) of microbial abundance at genus level. (C) Relative abundance of Firmicutes and Bacteroidetes at the phylum level. (D) Relative abundance of Lactobacillus at the genus levels. (E) Relative abundance of Lachnospiraceae NK4A136 at the genus levels. Significant differences are presented with the DSS group: *p < 0.05; **p < 0.01.

