
Figure 3. Beaver-only gene expansion, including tumor suppressor Hpgd.
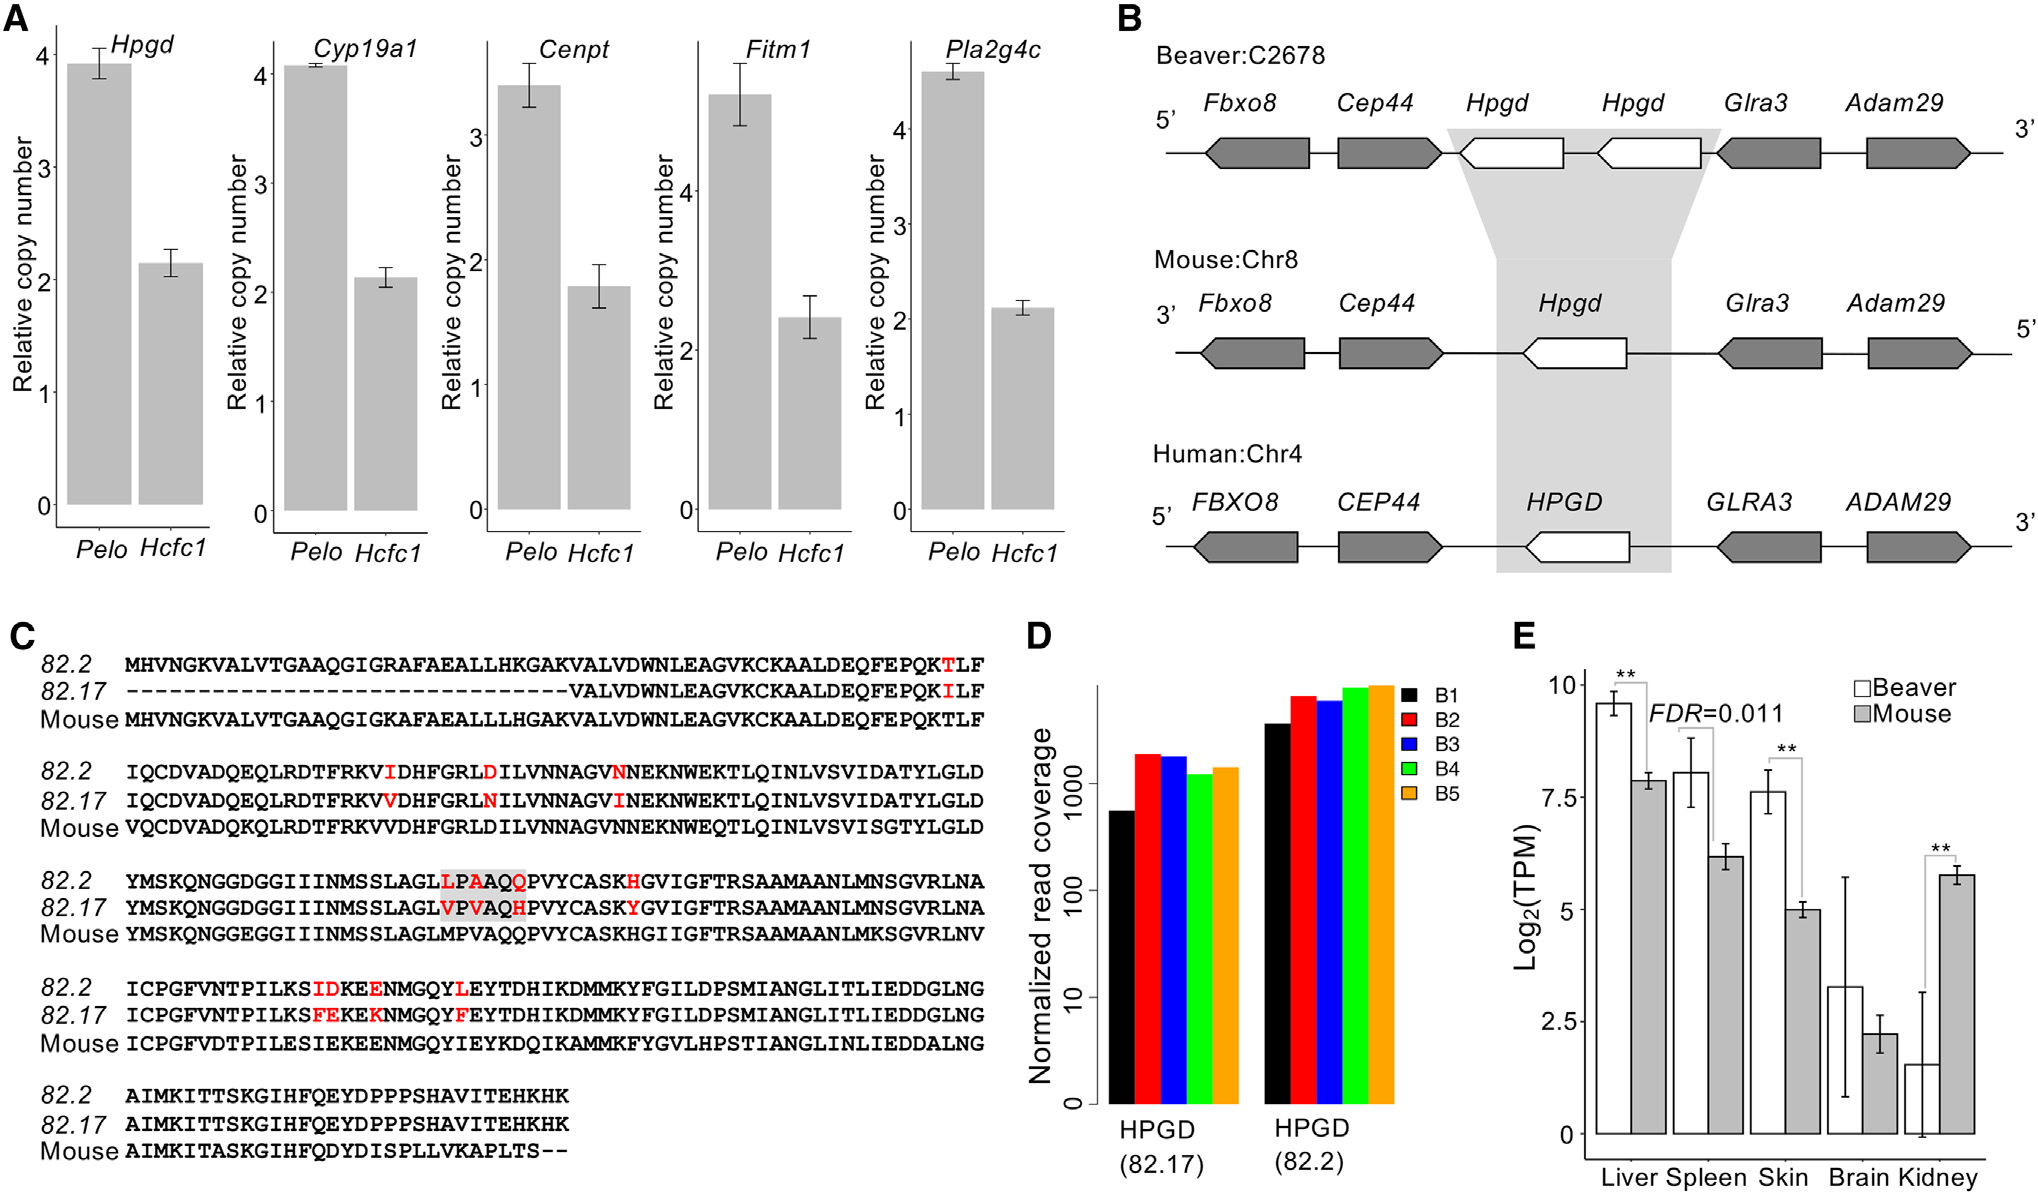
(A) qPCR validation of the copy number of beaver-only expanded genes. The copy numbers relative to the reference gene on chromosome X (i.e., Pelo) and on an autosome (i.e., Hcfc1) are shown for each candidate gene. Three technical replicates for each of the 3 different amounts of DNA input. Data are shown as mean ± SD.
(B) Synteny at the Hpgd locus.
(C) Alignment of beaver and mouse Hpgd protein sequences. Variable sites are highlighted in red, and the gray box indicates the selected sites where we checked the coverage of RNA-seq reads.
(D) Coverage of RNA-seq reads at the selected sites in individual beavers. RNA-seq reads from the liver tissue of 5 beaver samples (B1–B5) were used in the plot (Table S1). Normalized read coverage is the read counts per 100 million mapped reads.
(E) Expression of Hpgd in tissues of both beavers and mice (**adjusted p < 0.01, Bonferroni correction). Five biological replicates for beaver liver and skin tissues; 4 biological replicates for beaver brain, kidney, and spleen tissues. Five biological replicates for each tissue of mouse. Data are shown as mean ± SD.