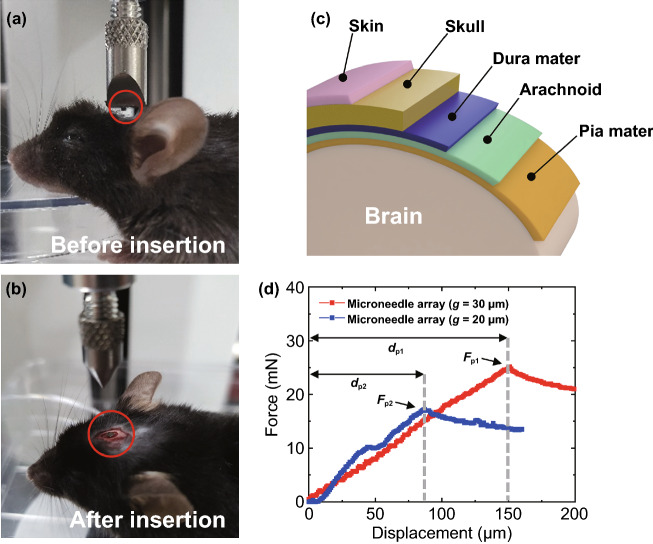
Fig. 10.
Insertion tests of the fabricated microneedle arrays to a mouse brain. a, b Microneedle array was positioned above the bregma and completely penetrated the brain. A microneedle array is shown in a red circle in both panels. c Schematic diagram showing layers of a mouse brain. In this experiment, skin and skull were removed but other layers were remained. d Force–displacement plot during the insertion of microneedle arrays with a speed of 10 μm s−1 into a mouse brain. We used the two microneedle arrays shown in Fig. 9b, c: the red and the blue traces show measured forces as a function of loading displacement for dull and sharp microneedles, g = 30 and 20 μm, respectively. Puncture force (Fp) and displacement (dp) were characterized for each array of microneedles. The vertical dashed gray lines divide pre- and post-penetration periods. (Color figure online)

