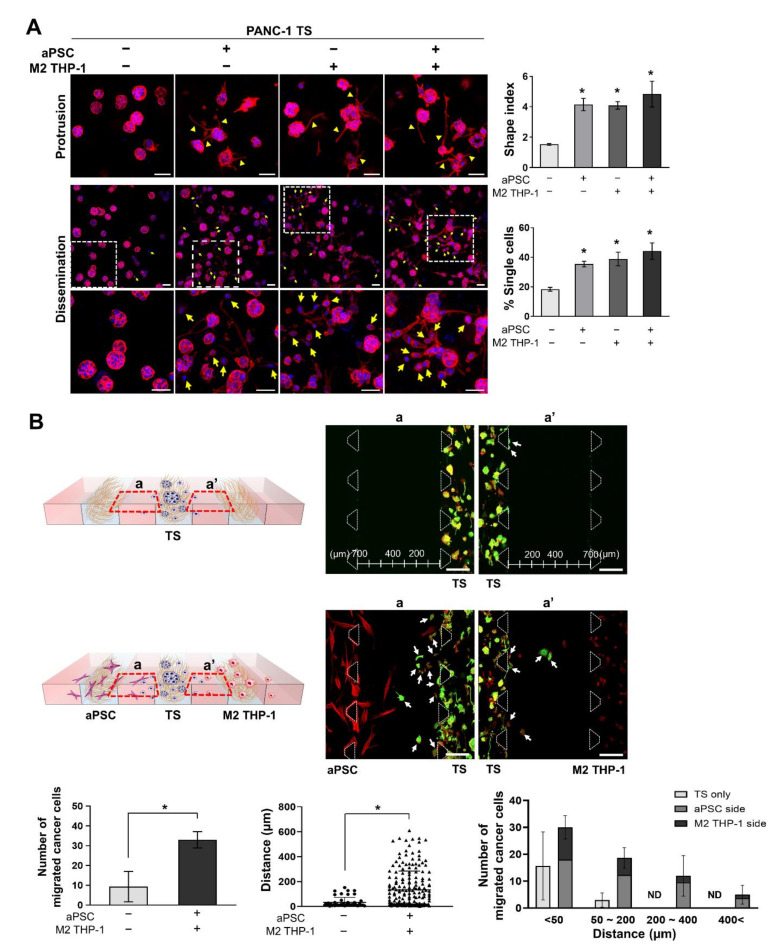
Figure 4.
Enhanced invasion and migration capacity of PANC-1 TSs under 3D co-culture conditions with stromal cells. (A) Morphological changes in PANC-1 TSs and single cell dissemination under co-culture conditions with aPSCs, M2 THP-1 cells, or both. Red: F-actin, blue: DAPI. Yellow arrow heads indicate membrane protrusions. The morphological changes were expressed using the shape index defined as perimeter2/(4π × area). Cells with a diameter between 10 to 20 µm were counted as single cells (yellow arrows). Scale bars: 50 µm. (B) The number of cancer cells that moved from the cell channel to the media channel, and the migrated distance were compared between the TS only and co-cultured groups. PANC-1 cells (green) migrated, and those found outside the cell channels are indicated by white arrows. The left graph shows the average number of migrated cancer cells. The graphs in the middle and right show the migrated distance and distribution of the number of migrated cancer cells against distance, respectively. Region (a) and (a′) indicate cells migrated into the media channels from each cell channels. Green: cytokeratin 19, red: F-actin. Data represent the mean ± SD of three independent experiments. Scale bars: 200 µm. * p < 0.05 compared to the TS only group. Cells were grown for 5 days before analysis. ND: not detected.

