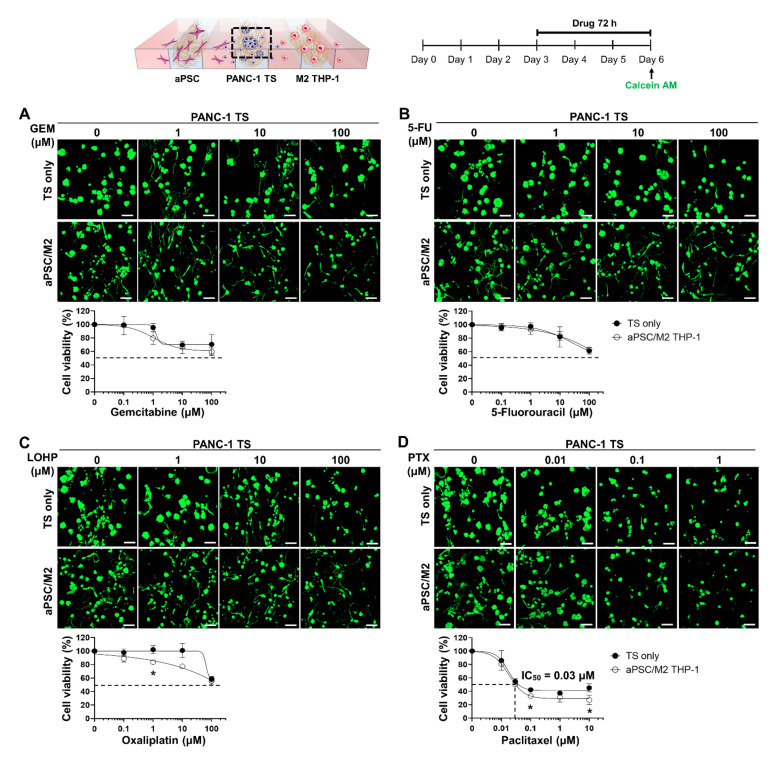
Figure 5.
Dose-response curve of the PANC-1 TSs only and co-culture groups when treated with different anti-cancer drugs. Cells grown for 3 days were subjected to 72 h of drug exposure. Cellular viability was measured after calcein AM staining. Representative images and drug-response curves determined in the PANC-1 TS only and co-culture with aPSCs and M2 THP-1 cells are shown for (A) GEM, (B) 5-FU, (C) LOHP, and (D) PTX. An IC50 value in the cell viability graph of PTX represents the concentration that causes 50% inhibition of cell viability. Data represent the mean ± SD of three independent experiments. Scale bars: 100 μm, * p < 0.05 compared to the TS only cultured group. GEM: gemcitabine; 5-FU: 5-fluorouracil; LOHP: oxaliplatin; PTX: paclitaxel.

