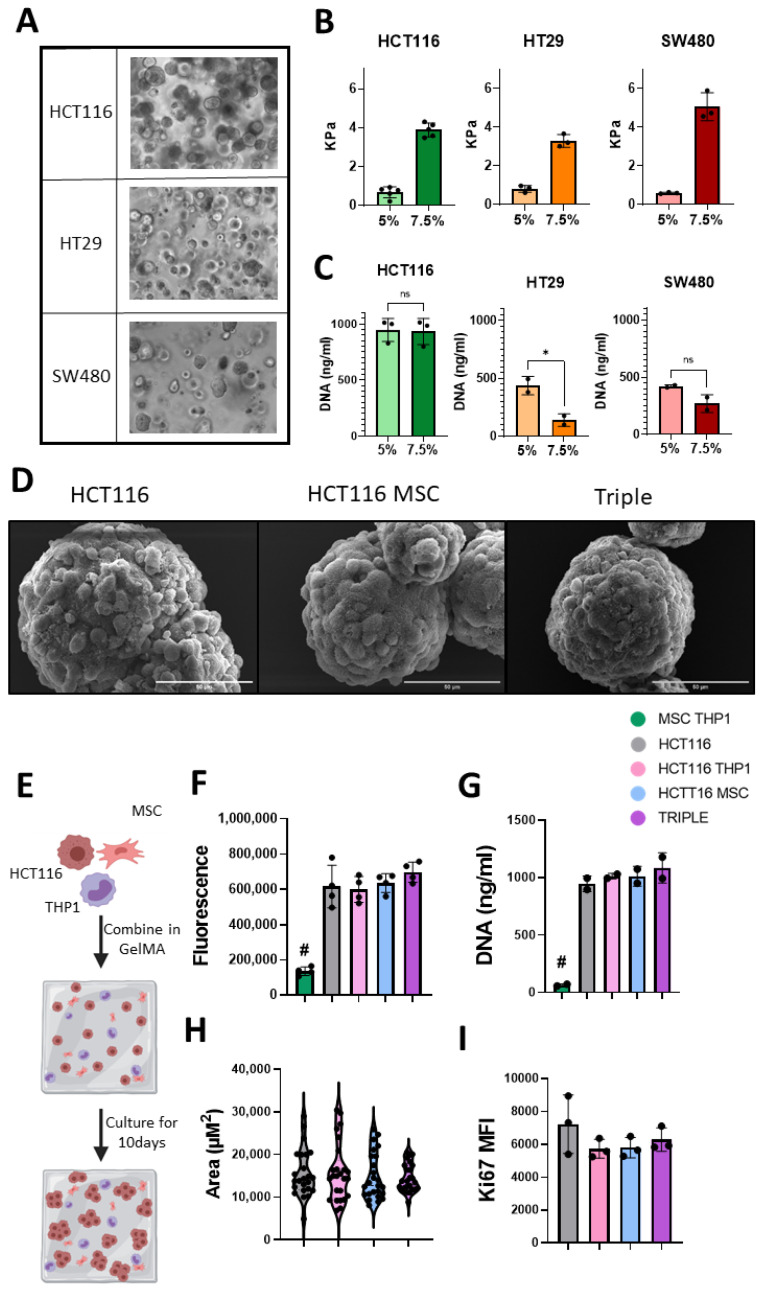
Figure 3.
GelMA culture system supports the growth of colon cancer cell lines within triple culture system. (A) Light microscopy images of spheroid formation from 3 CRC cell lines, HCT116, HT29 and SW480, at day 10 culture in 5% GelMA hydrogel, 20× magnification. (B) Rheometry measurements of GelMA stiffness at day 10 of culture (n = 3–5). (C) Proliferation of CRC cells at day 10 in 5% and 7.5% gels (n = 2–3) measured by CyQuant DNA analysis. (D) Representative SEM images of spheroid isolated from gels at day 10, scale = 50 μm. (E) Schematic description of 10-day GelMA triple culture system. (F) Alamar Blue measure of metabolic activity of cell contain gels at day 10 (n = 4). (G) Proliferation of cells at day 10 (n = 2) measured by CyQuant DNA analysis. (H) Spheroid size at day 10 (biological n = 5, technical n = 5). (I) Flow cytometry Ki67 expression in EpCAM positive cells isolated at day 10 (n = 3). Individual values are displayed as black dots on bar charts. Error bars represent mean ± SD. * p < 0.05, # p < 0.005 compared to all other groups, by t test or one-way ANOVA and Tukey post hoc test.

