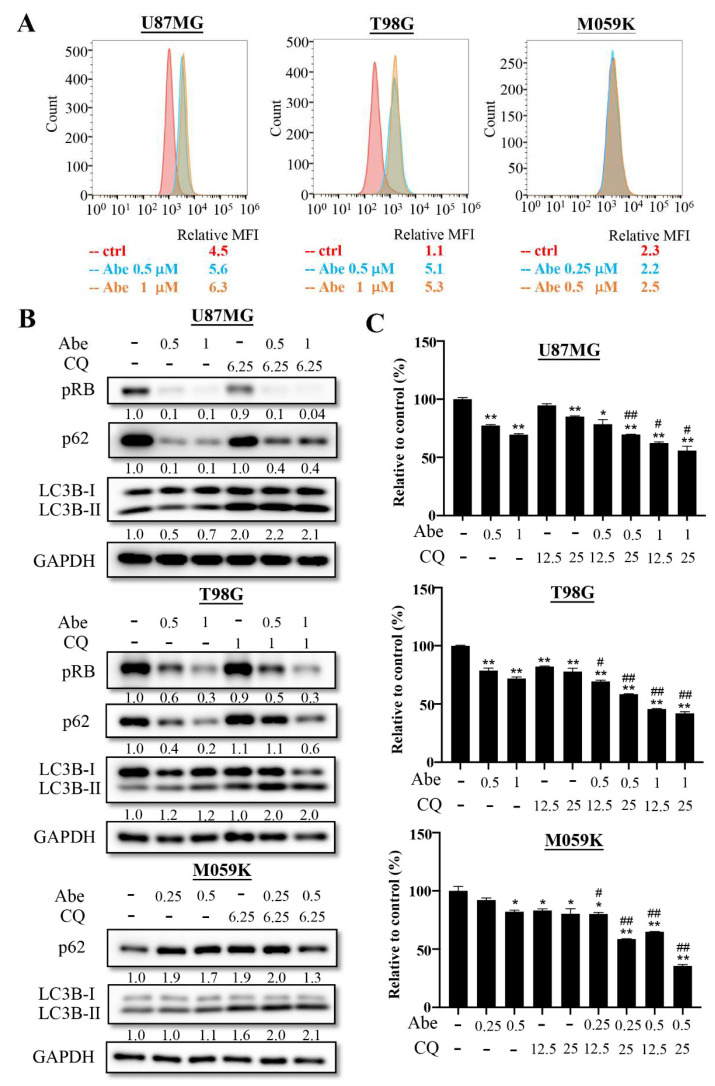
Figure 2.
Abemaciclib treatment induces autophagy activation in GBM cells. (A) The three cancer cells were treated with control or the indicated concentrations of abemaciclib for 24 h, and autophagy was determined using the DAPGreen Detection Reagent and flow cytometry. The mean fluorescence intensity (MFI) value was relative to the unstained control. (B) LC3B-II intensity after abemaciclib treatment (Abe, μM) in the absence or presence of chloroquine (CQ, μM) was detected via Western blot analysis (Figure S2). (C) The three cancer cells were treated with indicated concentrations (μM) of abemaciclib in the absence or presence of chloroquine (μM) for 72 h and subjected to MTT assay. Data are presented as the mean ± SD of duplicate wells and are representative of three independent experiments. Abe: abemaciclib. CQ: chloroquine. (* p < 0.05, ** p < 0.01 compared to control group, # p < 0.05, ## p < 0.01 compared to indicated concentrations of abemaciclib).

