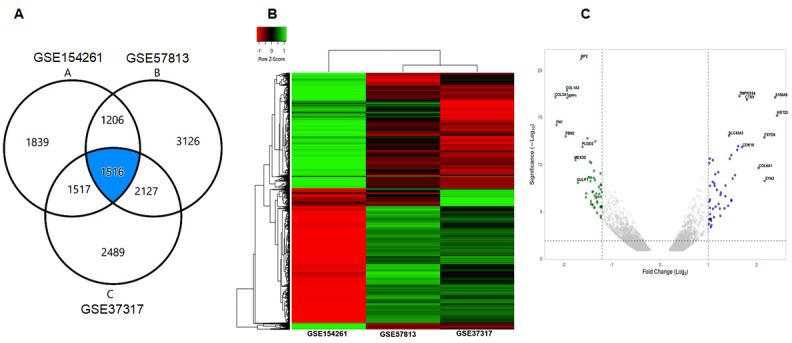
Figure 1.

Identification of differentially expressed genes (DEGs) between 3 datasets. (A) Venn-diagram exhibiting three database GSE154261, GSE37317 and GSE57813 showing common DEGs associated with bladder cancer. (B) The composite heat map of three datasets. (C) The volcano plot of the three datasets.
