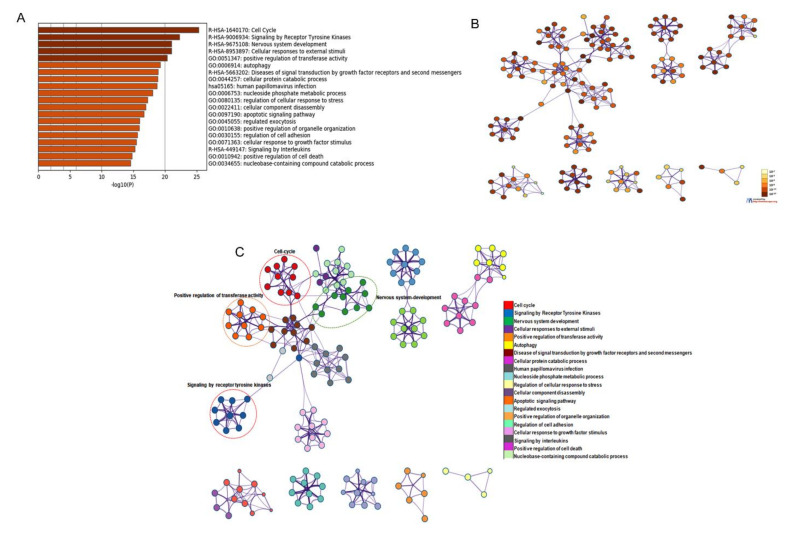
Figure 3.
GO and KEGG pathway analysis of DEGs in bladder cancer from the Metascape website. (A) The results of KEGG pathway analysis were plugin Cytoscape software and discrete color scale to represent statistical significance in terms of p-value. (B) Colored by p-value, where terms containing more genes tend to have a more significant p-value. (C) Gene cluster enrichment network visualization generated using 1516 DEGs associated with bladder cancer. Each node represents one enrichment term and its color represents the individual cluster identity (nodes with same color belong to same cluster).

