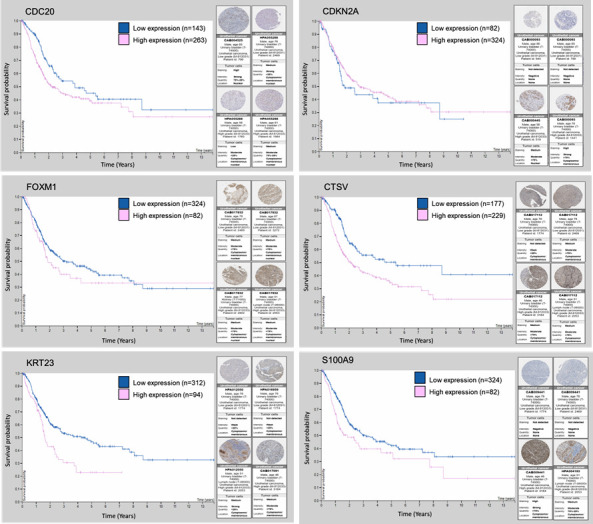
Figure 8.

Kaplan–Meier survival plots of CDC20, CDKN2A, CTSV, FOXM1, KRT23, and S100A9 and their protein expression stratified into low-risk and high-risk groups from the TCGA and human protein atlas database.

Kaplan–Meier survival plots of CDC20, CDKN2A, CTSV, FOXM1, KRT23, and S100A9 and their protein expression stratified into low-risk and high-risk groups from the TCGA and human protein atlas database.