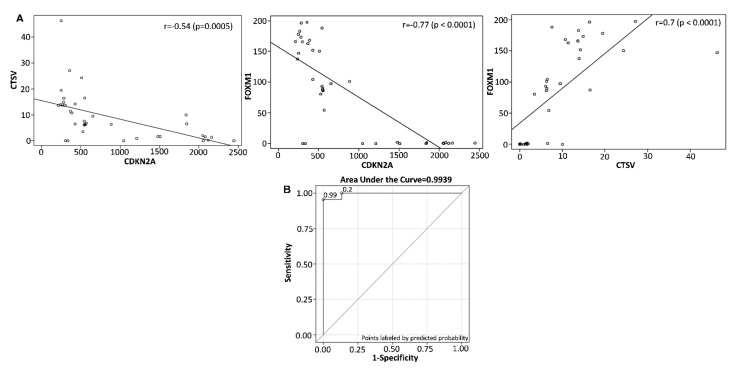
Figure 11.
Scatter plot of (A) CDKN2A versus CTSV. The Pearson correlation coefficient between CDKN2A and CTSV was -0.54 (p = 0.0005). CDKN2A vs. FOXM1. The Pearson correlation coefficient between CDKN2A and FOXM1 was −0.77 (p < 0.0001). CTSV versus FOXM1. The Pearson correlation coefficient between CTSV and FOXM1 was 0.7 (p < 0.0001). (B) ROC curve for the combination of three biomarkers (CDKN2a, CTSV, and FOXM1) with AUC = 0.9939, sensitivity of 95.5% and specificity of 100%.

