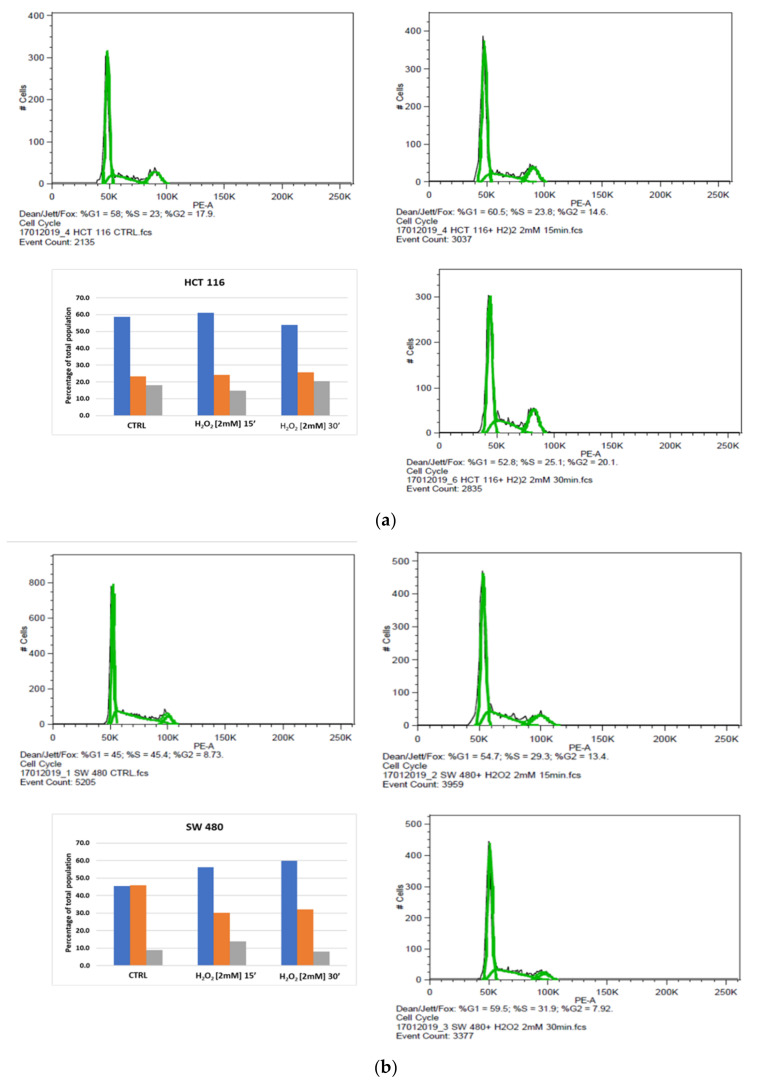
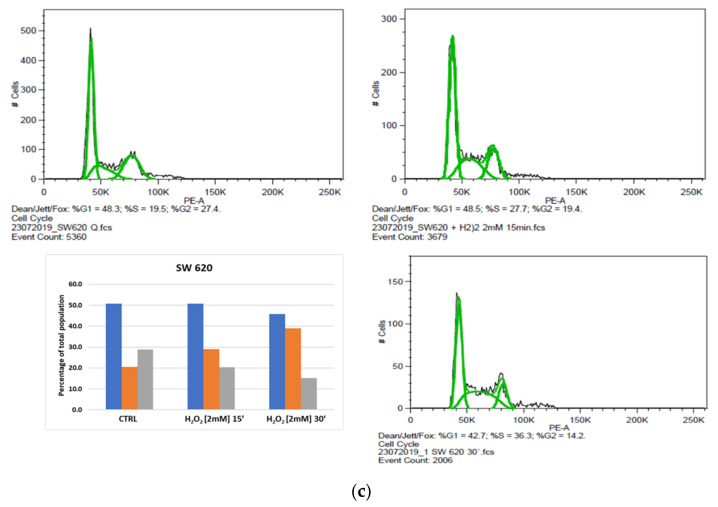
Figure 5.
Effect of acute oxidative distress on the cell cycle of starved colon cancer cell lines. Profile analysis and relative percentages in cell cycle stages: (a) HCT116, (b) SW480, (c) SW620. Representative plots of FACS analysis of HCT116, SW480 and SW620 cells, untreated and 15 or 30 min after treatment with 2 mM H2O2. Graphics indicate percentages of cells in each phase of the cell cycle. Blue bars represent G1/G0 phase, orange bars represent S phase and gray bars represent G2/M phase.


