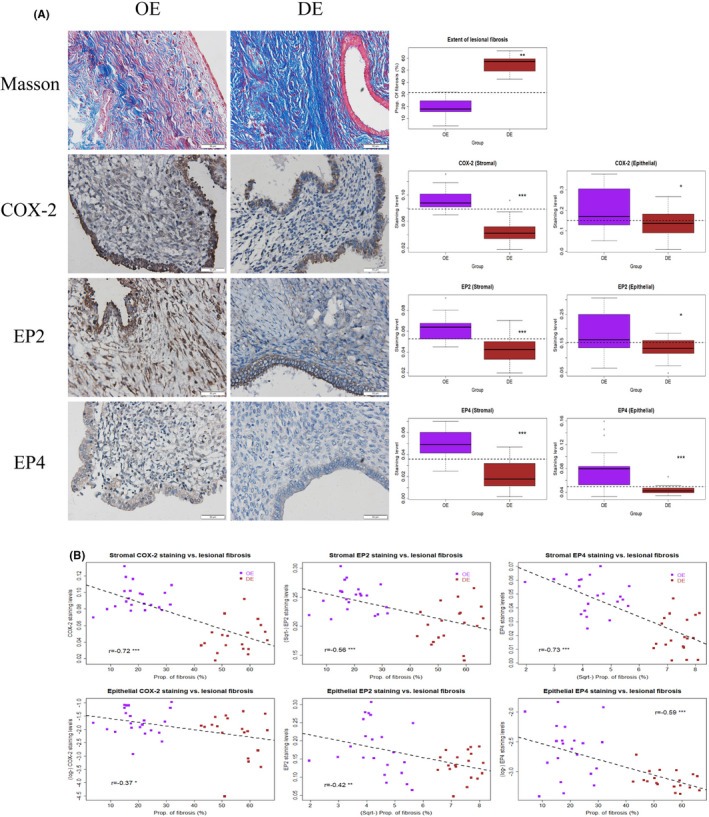
FIGURE 1.

(A) Representative photomicrographs of histochemistry (Masson trichrome) and immunohistochemistry analysis of COX‐2, EP2, and EP4 in samples of ovarian endometrioma (OE, left panel) and deep endometriosis (DE, middle panel), along with data summary (right panel). For both the left and middle panels, different rows show different markers as indicated. Magnification: ×400. Scale bar = 50 μm. On the right panel, the results are summarized by the boxplot. The results for COX‐2, EP2, and EP4 are for the stromal and the epithelial component. OE, ovarian endometriomas; DE, deep endometriosis; COX‐2, cyclooxygenase‐2; EP2 and EP4, E‐series of prostaglandin receptors type 2 and type 4, respectively. Wilcoxon's test was used in all cases. (B) Scatter plots showing the correlations between the extent of lesional fibrosis and the staining levels of COX‐2, EP2, and EP4 in the stromal (upper panel) and the epithelial components (lower panel). In each plot, each dot represents one data point from one patient, and the dashed line represents the regression line. The Pearson's correlation coefficient, along with its statistical significance level, also is shown. Symbols for statistical significance levels: *: p < 0.05; **: p < 0.01; ***: p < 0.001
