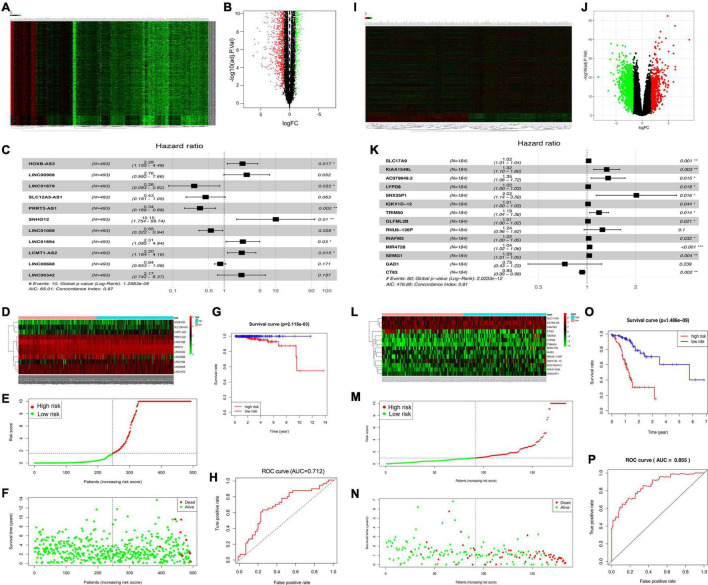
FIGURE 1.
Identification of significant PCa-related DElncRNAs and DEGs. Heat map demonstrating the DElncRNAs (A) and DEGs (I). Volcano plot showing the DElncRNAs (B) and DEGs (J), FC, fold change. (C) Forest map showing HRs (95% CIs) together with p-values for those screened DElncRNAs, and DEGs (K) by univariate Cox proportional hazards analysis. Heat map displaying the expression levels of OS-related DElncRNAs (D) and DEGs (L) in the high-risk and low-risk groups. (E,M) Risk curve plotted according to risk scores of all samples. (F,N) Scatterplot drawn according to patient survival status, where red and green dots denote death and survival, respectively. (G,O) KM curve showing the survival between low- and high-risk groups according to median risk score and risk model. (H,P) AUC values of clinical characteristics and risk score based on ROC curves.

