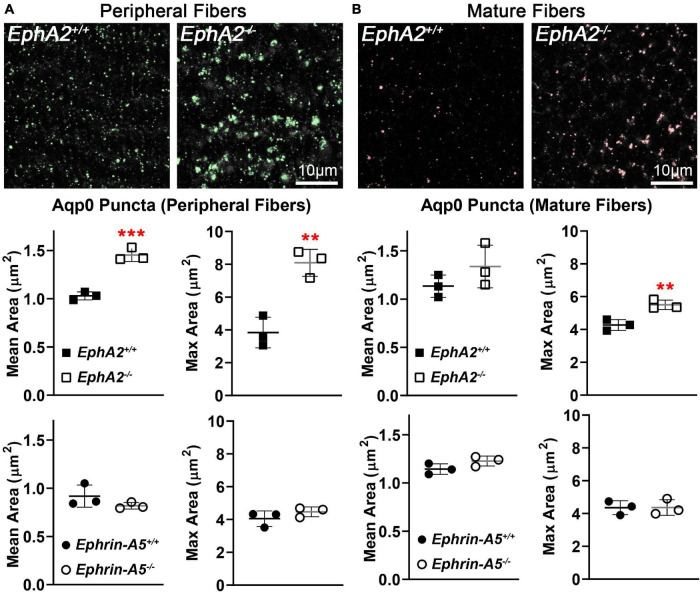
FIGURE 4.
Quantification of Aqp0 puncta in peripheral and mature fiber cells from cross sections of control, EphA2–/– and ephrin-A5–/– lenses. (A) In control peripheral lens fibers, there are relatively small Aqp0 puncta, while in EphA2–/– cells, there are much larger Aqp0 puncta/aggregates (highlighted in green). Quantification from three staining samples shows small Aqp0 puncta (mean and max puncta area, μm2) in EphA2+/+, ephrin-A5+/+ and ephrin-A5–/– peripheral lens fibers. In contrast, Aqp0 puncta/aggregates are significantly larger (mean and max area) in EphA2–/– peripheral lens fibers. (B) In mature EphA2–/– lens fibers, larger Aqp0 puncta/aggregates are observed (highlighted in red). Quantification shows increased Aqp0 max puncta area in EphA2–/– mature fibers. There are no changes in Aqp0 puncta found in ephrin-A5–/– mature lens fibers. Scale bars, 10 μm. **, p < 0.01 and ***, p < 0.001.

