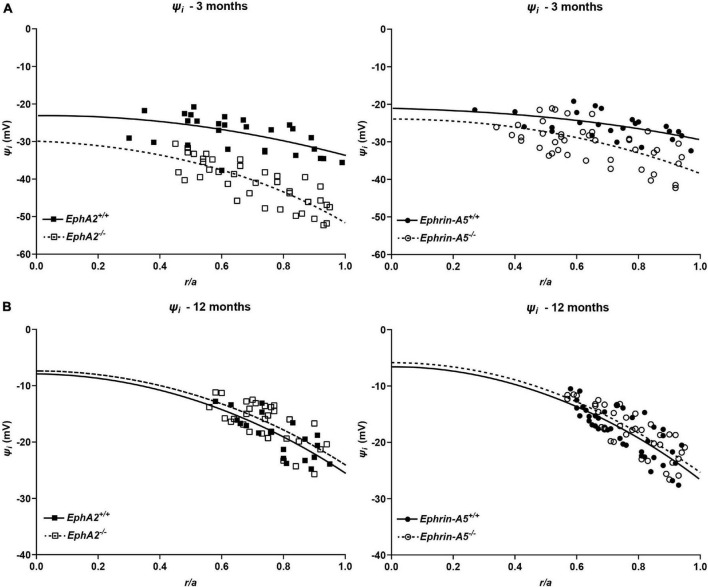
FIGURE 8.
Intracellular voltage (ψi) in lenses from 3- and 12-month-old control, EphA2–/– and ephrin-A5–/– mice. (A) Intracellular voltage in lenses from 3-month-old EphA2+/+ (black squares with solid fit line), EphA2–/– (open squares with dashed fit line), ephrin-A5+/+ (black circles with solid fit line), and ephrin-A5–/– (open circles with dashed fit line) lenses as a function of distance from lens center (r/a), where r (cm) is actual distance and a (cm) is lens radius. KO lenses were hyperpolarized when compared to controls (n ≥ 6). (B) Intracellular voltage in lenses from 12-month-old EphA2+/+ (black squares with solid fit line), EphA2–/– (open squares with dashed fit line), ephrin-A5+/+ (black circles with solid fit line), and ephrin-A5–/– (open circles with dashed fit line) lenses as a function of distance from the lens center. There are no significant differences in intracellular voltage between control and KO lenses (n ≥ 6).

