Figure 1.
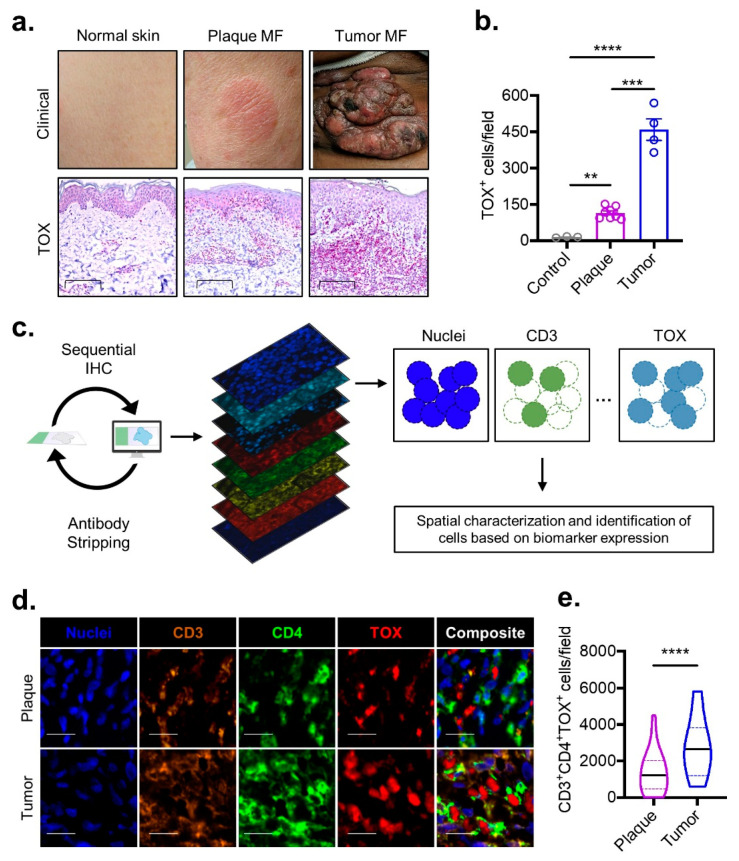
TOX density correlates with MF disease stage. (a) Representative clinical images (top) and high-powered immunohistochemical TOX staining (bottom, scale bar 100 µm) for non-neoplastic normal skin compared to plaque and tumor stage MF. (b) Composite data illustrating the number of TOX-positive cells per field for the groups described in subfigure (a) (n = 3 control, n = 7 plaques, n = 4 tumors). (c) Experimental schematic demonstrating the pipeline for employing multispectral imaging to quantify cells of a specific phenotype. Samples undergo sequential immunohistochemical staining for a panel of several biomarkers followed by computer vision-based analysis to locate and identify cell types. (d) Multispectral imaging (scale bar 20 µm) from plaque and tumor stage MF stained with the indicated biomarkers. (e) Violin plots of composite data enumerating density of CD3+CD4+TOX+ cells per multispectral field for pooled plaque (n = 5) or tumor (n = 2) MF samples. Bar plots represent mean ± SEM. Violin plots represent the median with the 25th and 75th percentiles. **, p < 0.01; ***, p < 0.001; ****, p < 0.0001 by one-way ANOVA with Sidak–Holm’s correction (panel b) or unpaired t-test with Welch’s correction (panel e).

