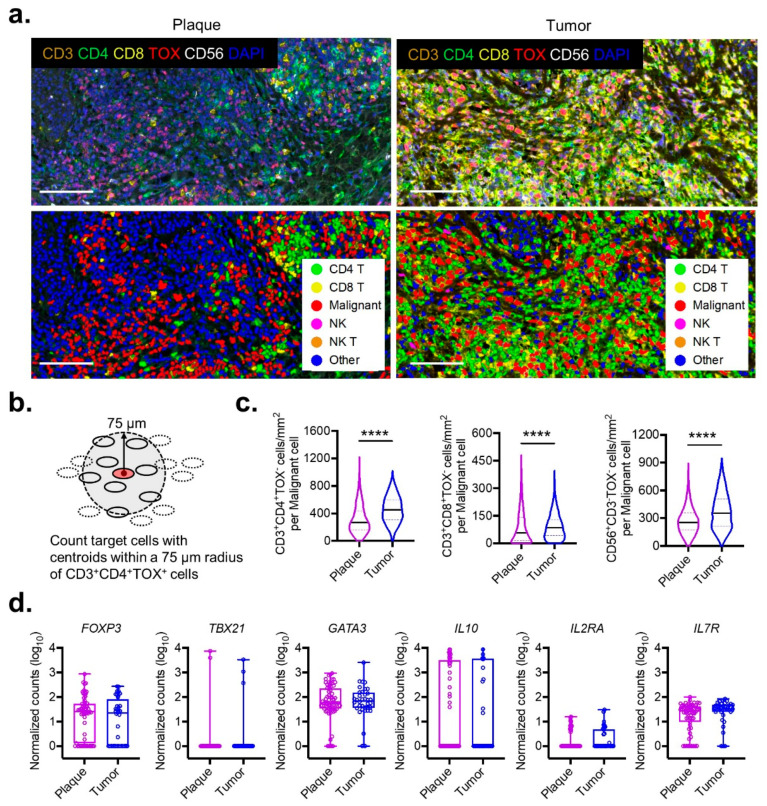
Figure 2.
Microarchitecture progression from plaque to tumor stage in MF. (a) Representative multispectral images (top) and cell segmentation with phenotype map (bottom) from plaque and tumor stage MF stained with the indicated biomarkers (scale bar 100 µm). (b) Schematic diagram for enumerating all cells of a specific phenotype within a 75 μm vicinity of malignant CD3+CD4+TOX+ cells. (c) Violin plots of composite data enumerating density of CD3+CD4+TOX−, CD3+CD8+TOX−, and CD56+CD3−TOX− cells within the vicinity of malignant cells as described in panel (b) for pooled plaque (n = 5) or tumor (n = 2) MF samples. At least five regions of interest were quantified for the analysis. ****, p < 0.0001 by unpaired t-test with Welch’s correction. (d) Normalized tissue RNA expression for the indicated genes between plaque- (n = 63) and tumor- (n = 36) stage MF samples. Bar plots represent mean ± SEM. Violin plots represent the median with 25th and 75th percentiles.

