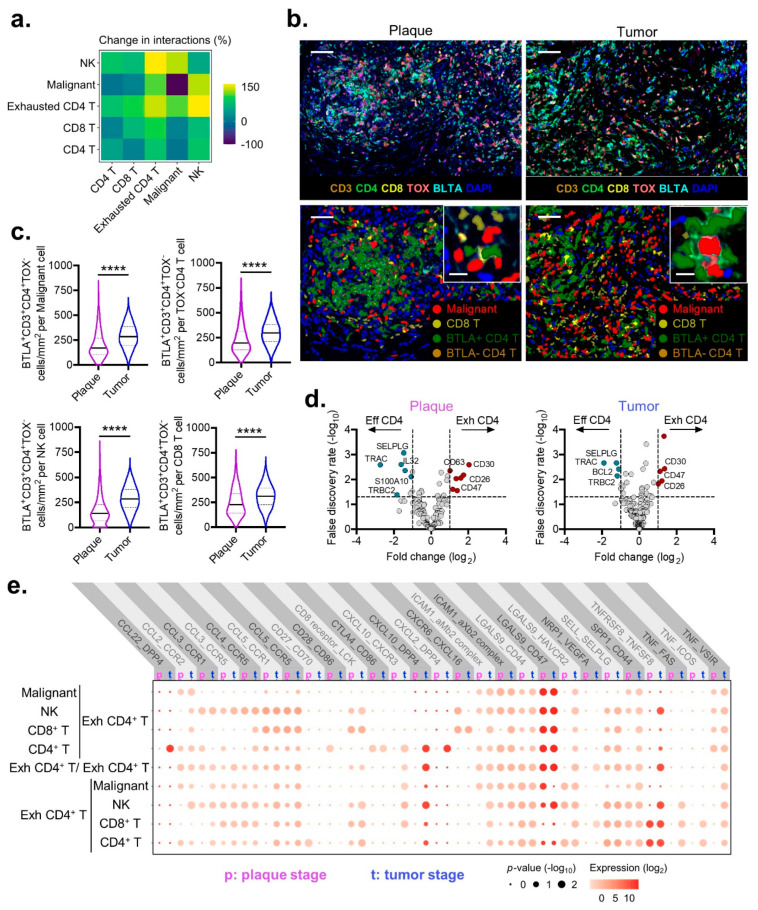
Figure 4.
Intercellular interactions between exhausted CD4+ T cells and TME. (a) Percent change in the number of intercellular interactions between the indicated immune cell types for tumor compared with plaque stage MF. A positive number indicates an increase in interactions from plaque to tumor. (n = 1 patient with plaque MF and 3 patients with tumor MF) (b) Representative multispectral images from plaque and tumor-stage MF stained with the indicated biomarkers (top) (scale bar 50 µm; insert, scale bar 10 µm). Cell segmentation with phenotype map for malignant, CD8+ T, BTLA+ CD4+ T, and BLTA− CD4+ T cells, with inset highlighting spatial arrangement of BTLA+ CD4+ non-malignant cells in the immediate vicinity of malignant cells (bottom). (c) Violin plots of composite data enumerating the density of exhausted BTLA+CD3+CD4+TOX− cells within the immediate 75 um vicinity of malignant and non-malignant CD4+ T, NK, and CD8+ T cells from pooled plaque- (n = 5) or tumor- (n = 2) stage MF samples. At least five regions of interest were quantified for the analysis. Violin plots represent the median with 25th and 75th percentiles. ****, p < 0.0001 by unpaired t-test with Welch’s correction. (d) Volcano plots demonstrating differential gene expression between effector and exhausted CD4+ T cells for plaque and tumor stage MF samples. (e) Intercellular CellPhoneDB analysis illustrating shifts in expression of the indicated ligand–receptor complexes for exhausted cells between plaque and tumor stage MF.

