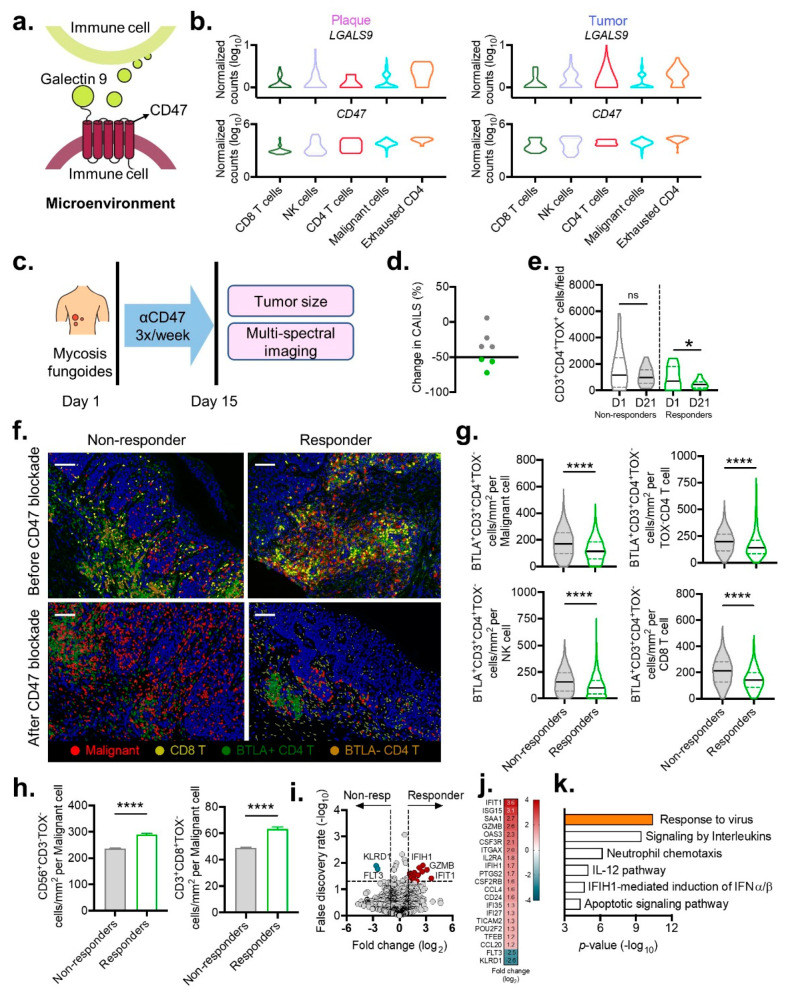
Figure 5.
Immunologic shifts within the tumor microenvironment induced by CD47 blockade. (a) Model of the Galectin-9-CD47 complex between two immune cells. (b) Violin plots show log-transformed, normalized expression levels of the components of the Galectin-9-CD47 complex from plaque (left) and tumor stage (right) MF samples. (c) Schematic for intralesional CD47 blockade with a SIRPαFc fusion decoy receptor (TTI-621) three times per week for two weeks in a cohort of 7 patients with MF. (d) Percent change in CAILS after treatment with CD47 blockade. Responders with at least 50% decrease in CAILS are labeled in green. Non-responders with less than 50% decrease in CAILS are labeled in gray. (e) Violin plots of composite data enumerating density of malignant CD3+CD4+TOX+ cells per field before and after CD47 blockade for responders compared with non-responders. (f) Representative cell segmentation with phenotype map for malignant, CD8+ T, BTLA+ CD4+ T, and BLTA− CD4+ T cells for responders and non-responders before and after CD47 blockade (scale bar 100 µm). (g) Violin plots of composite data enumerating the density of exhausted BTLA+CD3+CD4+TOX− cells within the immediate 75 μm vicinity of malignant and non-malignant CD4+ T, NK, and CD8+ T cells from responder or non-responders before (top) and after (bottom) CD47 blockade. Violin plots represent the median with 25th and 75th percentiles. *, p < 0.05; ****, p < 0.0001 by unpaired t-test with Welch’s correction. (h) Composite data comparing the density of cytotoxic NK (CD56+CD3−TOX−) and CD8+ T (CD3+CD8+TOX−) cell density within the immediate 75 μm vicinity of malignant cells from responder or non-responder clinical samples. (i) Volcano plot illustrating differential tissue gene expression from responder or non-responder clinical samples. (j) Statistically significant genes up- and downregulated in responders. (k) Metascape gene enrichment analysis for significantly upregulated genes identified in subfigure (j).

