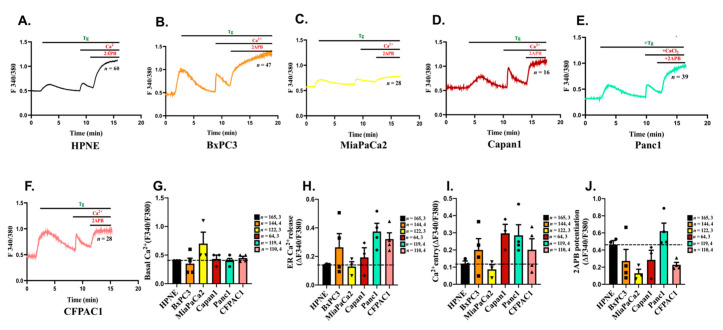
Figure 2.
Characterization of SOCE in a battery of Pancreatic cancer cell lines. (A–F) Representative Ca2+ imaging traces of HPNE, BxPC3, MiaPaCa2, Capan1, Panc1 and CFPAC1 cells where “n” denotes the number of cells in that particular trace. (G) Quantitation of basal Ca2+ levels across different cell lines. (H) The amplitude of ER Ca2+ release was calculated from a number of experiments and data are presented in dot plot graphs. (I) The extent of SOCE was calculated from several experiments and data are presented in dot plot graphs. (J) 2-APB induced potentiation of Orai3 mediated SOCE was calculated from several experiments and data are presented in dot plot graphs. The total number of cells imaged in (G–J) are reported as “n = x, y” where “x” denotes total number of cells imaged and “y” denotes number of traces recorded.

