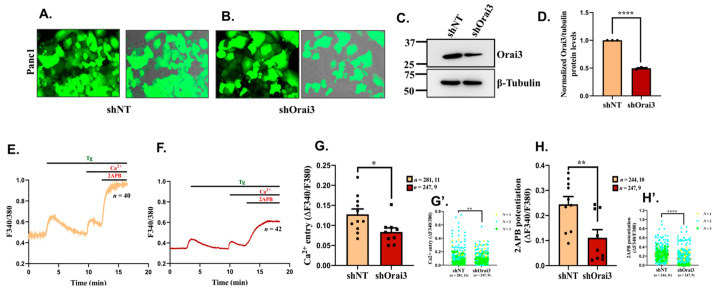
Figure 3.
Orai3 encodes a functional SOCE channel in Panc1 cells. (A,B) Lentiviral transduced Panc1 cells stably expressing either GFP tagged shNT control or GFP tagged shRNA targeting Orai3 (fluorescence and merged images of bright field plus fluorescence are presented). (C) Representative Western blot showing knockdown of Orai3 in shOrai3 Panc1 stables in comparison to shNT control Panc1 stable cells. (D) Densitometric analysis of Orai3 silencing in 3 independent shNT and shOrai3 Panc1 stable clones. (E) Representative Ca2+ imaging trace of shNT Panc1 stables where “n = 40” denotes the number of cells in that particular trace. (F) Representative Ca2+ imaging trace of shOrai3 Panc1 stables where “n = 42” denotes the number of cells imaged in that particular trace. (G) The extent of SOCE was calculated from 281 shNT and 247 shOrai3 cells, which were imaged from several autonomous experiments/traces (11 traces of shNT and 9 traces of shOrai3 originating from 3 independent clones of shNT and shOrai3 Panc1 stables) and data from autonomous traces are presented in dot plot graphs. (G’) Data for extent of SOCE from all individual cells from 3 independent clones are presented as clone N°1 yellow rounds, clone N°2 blue squares, clone N°3 green diamond. (H) 2-APB induced potentiation of Orai3 mediated SOCE was calculated from around 250 cells/condition. These cells were imaged during several autonomous experiments/traces (10 traces of shNT and 9 traces of shOrai3 originating from 3 independent clones of shNT and shOrai3 Panc1 stables) and data are presented in dot plot graphs. (H’) Data for 2-APB induced SOCE potentiation from all individual cells from 3 independent clones are presented as clone N°1 yellow rounds, clone N°2 blue squares, clone N°3 green diamond. The total number of cells imaged are reported in (G,H) as “n = x, y” where “x” denotes total number of cells imaged and “y” denotes number of traces recorded. Data presented are mean ± S.E.M. Unpaired Student’s t-test was performed for statistical analysis. p-value < 0.05 was considered as significant and is presented as “*”; p-value < 0.01 is presented as “**”and p-value < 0.0001 is presented as “****”.

