Figure 4.
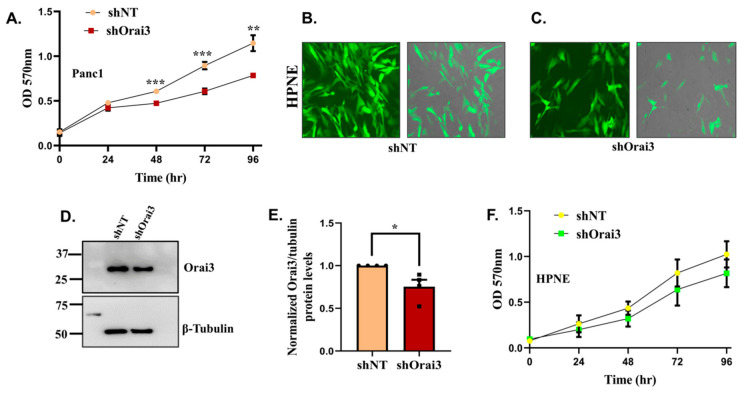
Orai3 regulates Panc1 but not HPNE cell viability. (A) MTT assay-based cell viability analysis (24–96 h time points) in Panc1 shNT and Panc1 shOrai3 stable cells (n = 5). (B,C) Lentiviral transduced HPNE cells stably expressing either GFP tagged shNT control or GFP tagged shRNA targeting Orai3 (fluorescence and merged images of bright field plus fluorescence are shown). (D) Representative Western blot showing knockdown of Orai3 in shOrai3 HPNE stables in comparison to shNT control HPNE stable cells. (E) Densitometric analysis of Orai3 silencing in 4 independent shNT and shOrai3 HPNE stable clones. (F) MTT assay-based cell viability analysis (24–96 h time points) in HPNE shNT and HPNE shOrai3 stable cells (n = 4). Data presented as mean ± S.E.M. Unpaired Student’s t-test was performed for statistical analysis. p-value < 0.05 was considered as significant and is presented as “*”; p-value < 0.01 is presented as “**”and p-value < 0.001 is presented as “***”.

