Figure 8.
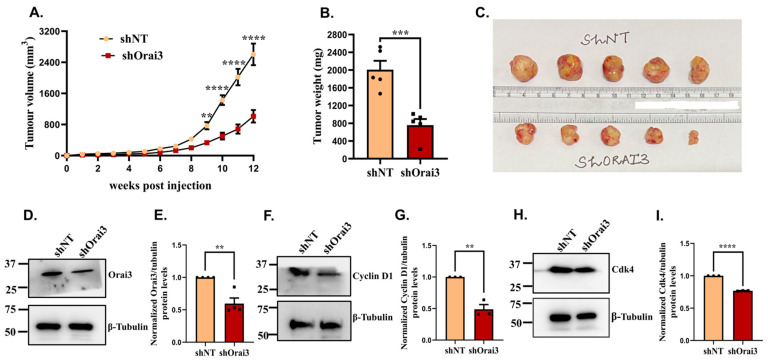
Orai3 regulates pancreatic cancer progression in vivo. (A) Weekly tumor volume measurements in NOD SCID mice injected with either shNT Panc1 cells or shOrai3 Panc1 cells (n = 5 mice/condition). (B). Tumor weight measurements after sacrificing mice at 12-week post-injections (either shNT Panc1 or shOrai3 Panc1 injections) timepoint. (C). Pictures of shNT and shOrai3 Panc1 tumors harvested after 12 weeks of injections. (D). Western blot analysis for Orai3 expression in shNT Panc1 and shOrai3 Panc1 tumors. (E). Densitometric analysis of validating Orai3 knockdown in shOrai3 Panc1 tumors in comparison to shNT Panc1 tumors. (F). Western blot analysis for cyclin D1 levels in shNT Panc1 and shOrai3 Panc1 tumors. (G). Densitometric analysis of cyclin D1 levels in shNT Panc1 and shOrai3 Panc1 tumors. (H). Western blot analysis for Cdk4 expression in shNT Panc1 and shOrai3 Panc1 tumors. (I) Densitometric analysis of Cdk4 levels in shNT Panc1 and shOrai3 Panc1 tumors. Data presented as mean ± S.E.M. Unpaired Student’s t-test was performed for statistical analysis except from tumor volume wherein two-way ANOVA was performed. p-value < 0.01 is denoted as “**”; p-value < 0.001 is presented as “***” and p-value < 0.0001 is denoted as “****”.

