Figure 1.
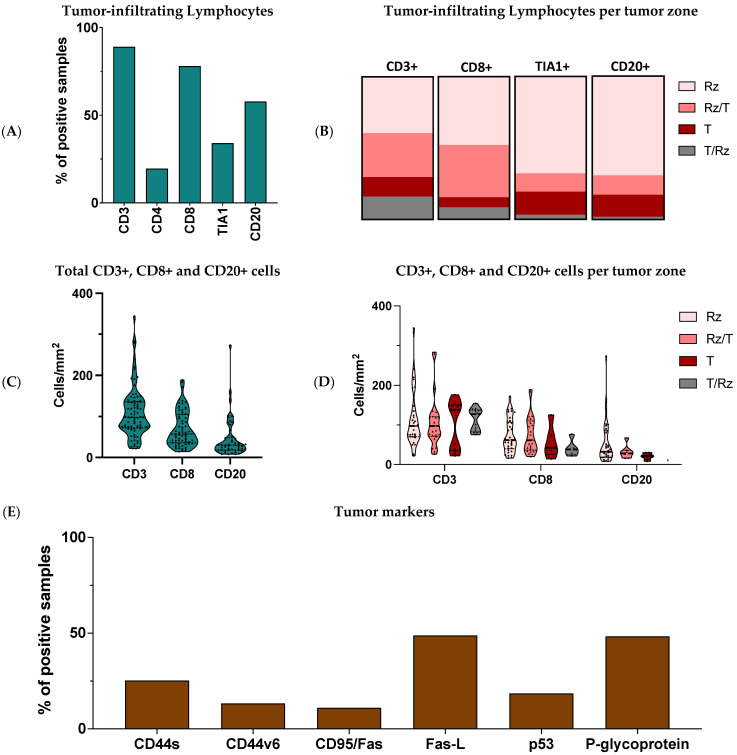
Characterization of the OST microenvironment. Tumor tissues were collected from 93 OST patients and evaluated through IHC staining. (A) Frequency of positive samples for CD3+, CD4+, CD8+, TIA1+ and CD20+ infiltration. (B) Distribution of the CD3+, CD8+, TIA1+ and CD20+ cells according to the tumoral region. (C) CD3+, CD8+ and CD20+ cell number. (D) CD3+, CD8+ and CD20+ cell number according to the tumoral region. (E) Frequency of positive samples for CD44s, CD44v6, CD95/Fas, Fas-L, p53 and p-glycoprotein expression. Rz—reactive zone; T—tumor zone; IHC—Immunohistochemical.

