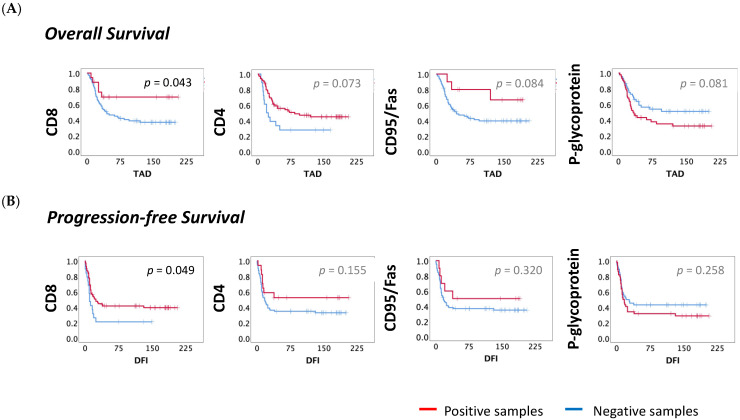
Figure 2.
OS and PFS curves according to TILs and the molecules expressed in the tumor. The survival curves for OS and PFS were obtained by the Kaplan–Meyer (Log-rank) method. (A) Impact on OS—The median OS for infiltration of CD8+ and CD4+ cells, expression of CD95/Fas and p-glycoprotein non-expression were higher when compared to their counterparts ((CD8−: TAD = 61, N = 18; vs. CD8+: TAD = 112, N = 69); (CD4−: TAD = 94, N = 71; vs. CD4+: TAD = 149, N = 17); (CD95/Fas−: TAD = 99, N = 77 vs. CD95/Fas+: TAD = 150, N = 10); (p-glycoprotein−: TAD = 117, N = 45; p-glycoprotein+: TAD = 87, N = 44)). (B) Impact on PFS—The median PFS for CD8 infiltration was longer when compared to their counterpart (CD8−: DFI = 39, N = 19 vs. CD8+: DFI = 91, N = 69). IHC—Immunohistochemical; OS—overall survival (months); PFS—progression-free survival; TAD—time after diagnosis (months); DFI—disease-free interval (months). Statistical significance was set at p < 0.05.

