Figure 6.
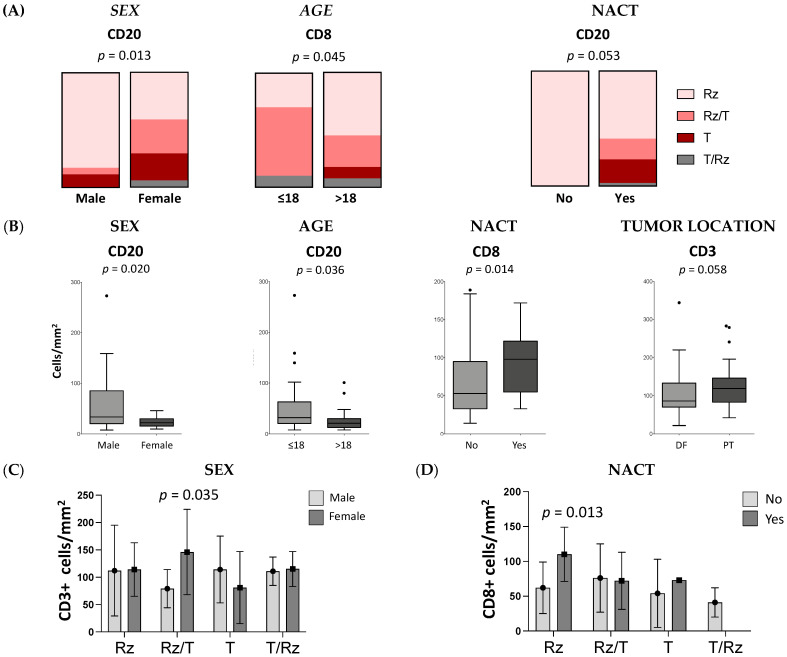
The influence of cell distribution and number on sex, age, tumor location or neoadjuvant chemotherapy. Tumor tissues were collected from 93 OST patients and evaluated using IHC staining. (A) Illustration of the tumoral distribution of CD20+ cells by sex, CD8+ cells by age and CD20+ cells by neoadjuvant chemotherapy. Comparative analysis was performed using Fisher’s exact test. (B) Count of CD20+ cells according to sex and age, CD3+ cells according to tumor location and CD8+ cells according to neoadjuvant chemotherapy. (C) CD3+ cell count per tumoral region in males and females (Rz/T: females = 146, SD = 78, N = 10; vs. males = 79 cells, SD = 35, N = 15). (D) CD8+ cell count per tumoral region in no-NACT and NACT patients (Rz: NACT = 110, SD = 39, N = 8; vs. no-NACT = 62, SD = 37, N = 26). Mann–Whitney U test was used to compare means between two groups and two-way ANOVA followed by Sidak’s multiple comparisons test was used to compare more than two groups. IHC—Immunohistochemical; DF—distal femur; PT—proximal tibia; NACT—neoadjuvant chemotherapy; Rz—reactive zone; T—tumor zone.

