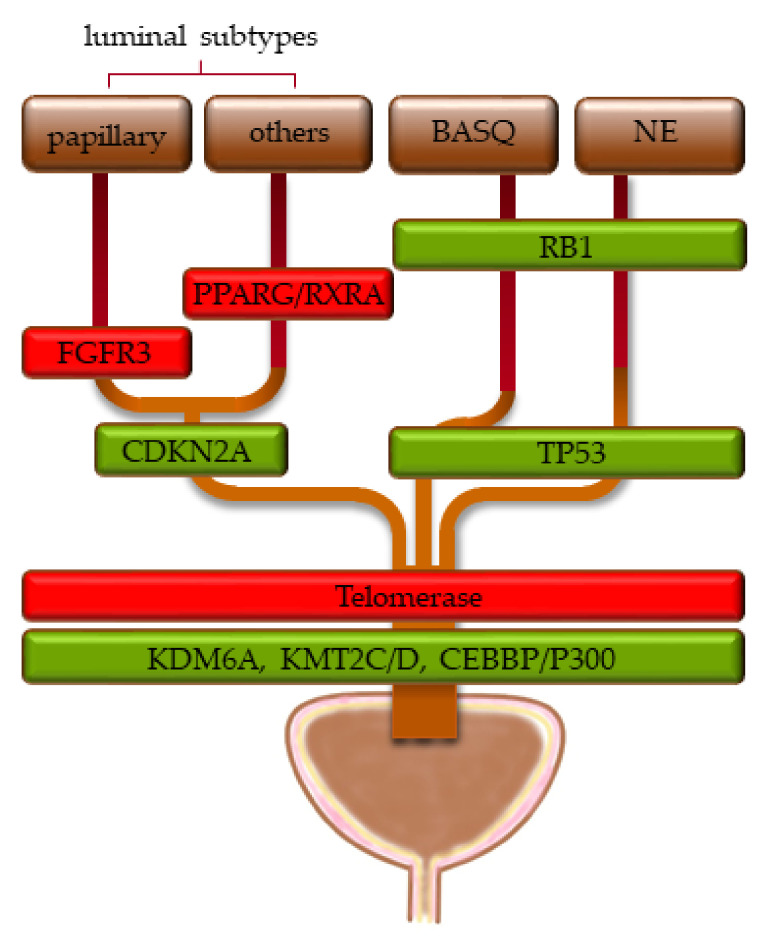
Figure 2.
Proposed sequence of genomic changes in urothelial carcinogenesis, proceeding from bottom to top. Green boxes indicate loss of function, red boxes indicate oncogenic activation. The width of the boxes indicates the approximate distribution of the genomic alterations across the molecular subtypes (see Section 1.2 for their definitions).

