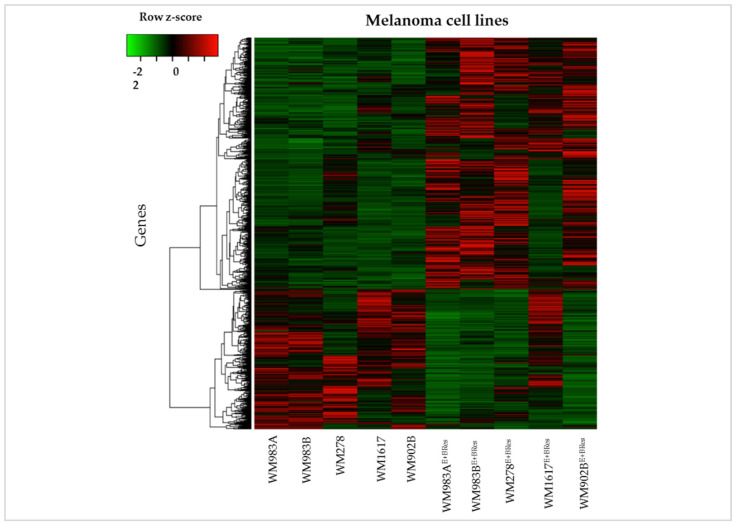
Figure 8.
Unsupervised hierarchical clustering of the 1591 differentially expressed genes in BRAFi/MEKi-sensitive and -resistant melanoma cell lines. Cell lines are displayed vertically, and genes are displayed horizontally. The colour of each cell represents the median-adjusted expression value of each gene. Red represents increased gene expression, and green represents decreased gene expression.

