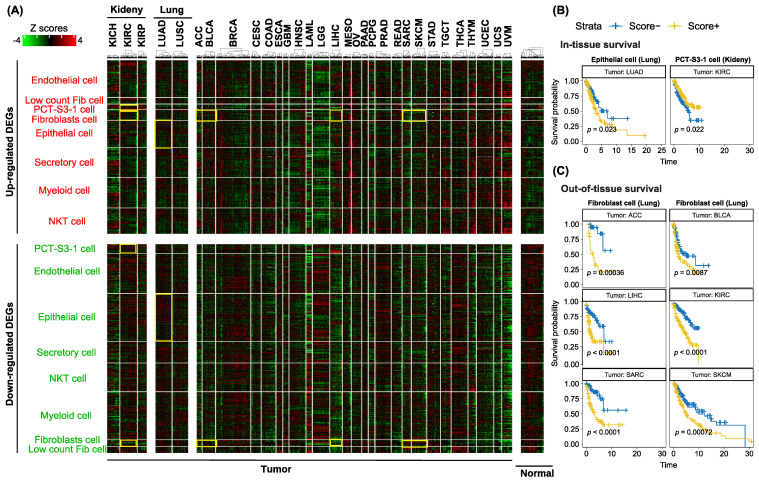
Figure 5.
Single-cell transcriptomic profibrotic signatures in TCGA tumors and their prognosis. (A) Heatmap showing cell-type-specific differential gene signatures across all the TCGA tumor and adjacent normal samples. Each row is a differential gene, while each column is a tumor or normal sample. Gene expression is row-scaled and capped at +/− 4 standard deviations. Heatmap color scheme is shown on the top left corner, with green representing low gene expression and red indicating high gene expression. Rows and columns are aggregated into categories of cell types, and different tumor types and adjacent normal groups, respectively. (B) The Kaplan-Meier survival curve, using epithelial and PCT-S3-1 cell-derived profibrotic scores to predict prognosis in tumor patients of LUAD and KIRC, separately. (C) The Kaplan-Meier survival curve, using fibroblast cell-derived profibrotic scores to predict prognosis in patients of TCGA tumor type of ACC, BLCA, LIHC, KIRC, SARC, and SKCM. Fibroblast cell is originally native to the lung.

