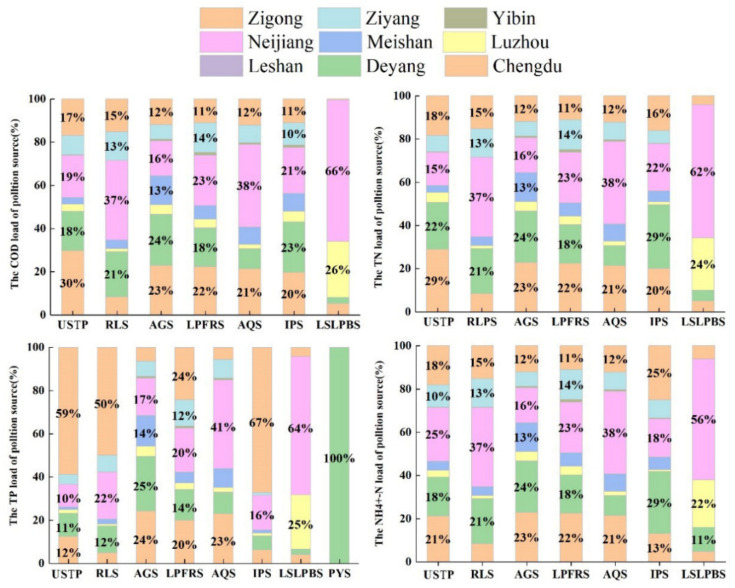
Figure 9.
The contribution ratio of different cities to different pollution sources. The y-axis represents the pollutant loads from the USTP (Urban sewage treatment plant), RLS (rural living source), AGS (Agricultural source), LPFRS (Livestock and free range poultry sources), AQS (Aquaculture source), IPS (Industrial point source), LSLPBS (Large-scale livestock and poultry breeding source) and PYS (Phosphogypsum yard source).

