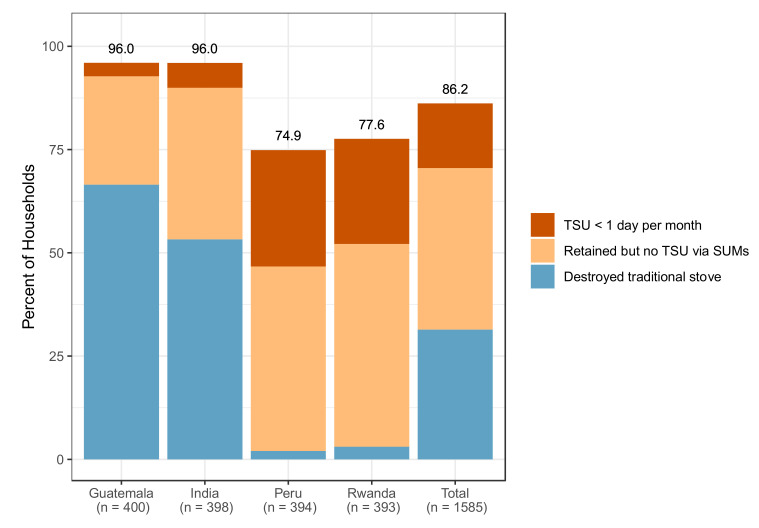
Figure 4.
Disuse of traditional stoves in the intervention households. Each stacked bar represents the percent of the intervention households in an IRC who either: destroyed their traditional stove upon LPG installation (blue); retained their traditional stove but no evidence of use was observed over the gestational period (using SUMs, sepia); or used their traditional stove on less than one occasion per month over the gestational period (using SUMs, red). Numbers on top of each bar represent the sum of these categories in each IRC. The total bar presents the average across all four IRCs.

