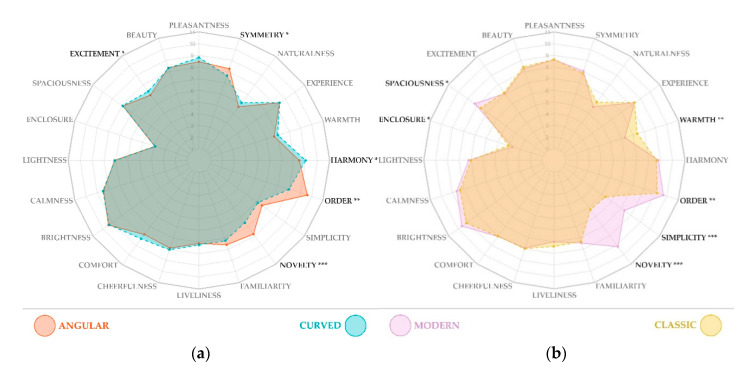
Figure 4.
Display of participants’ responses to the bipolar dimensions of the affective and spatial experience questionnaire. The scales were converted from (−5, 0, 5) to (1–11) for analysis and display purposes. Individual scores were calculated based on averaging responses to every two rooms presenting the same condition, and the charts’ scores represent means on each of the dimensions. Plot (a) displays results for contour conditions (angular vs. curved), and plot (b) shows results of style conditions (modern vs. curved). Significant dimensions are marked with asterisks (*** for p < 0.001, ** for p < 0.01, and * for p < 0.05) and are written in black color for ease of reference. These graphics were created in R Studio, using package fmsb (Minato Nakazawa, 2021, Available on https://cran.r-project.org/web/packages/fmsb/index.html).

