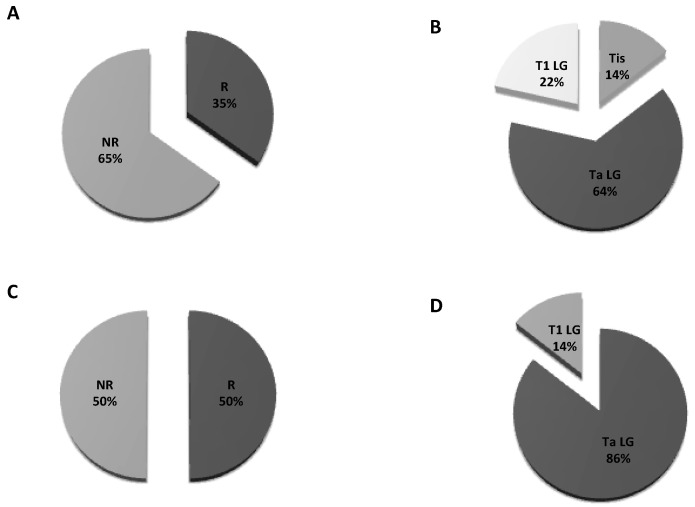
Figure 2.
Pie charts of proportions for recurrence: (A) Patients’ distribution at the first follow up; (B) T stage distribution in patients developing recurrence at the first follow up; (C) patients’ distribution at the second follow up; (D) T stage distribution in patients developing recurrence at the second follow up. R = recurrent; NR = non recurrent.

