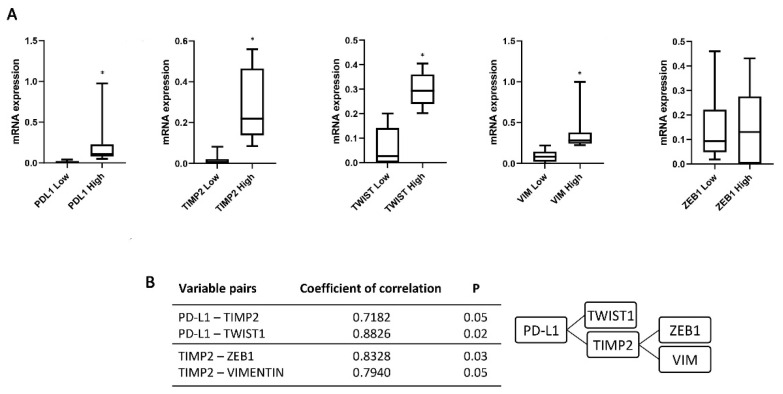
Figure 3.
Expression of PD-L1, TIMP2, TWIST1, ZEB1 and VIM in CTCs isolated from NMIBC patients. (A) The expression was evaluated by ddPCR in NMIBC patients stratified according the recurrence at the first follow up. Expression values are presented as median with interquartile ranges (boxplot). p value was based on the Mann-Whitney U test, * p < 0.0001. (B) Correlation index evaluated for PD-L1-TIMP2, PD-L1-TWIST1, TIMP2-ZEB1 and TIMP2-VIM variable pairs.

