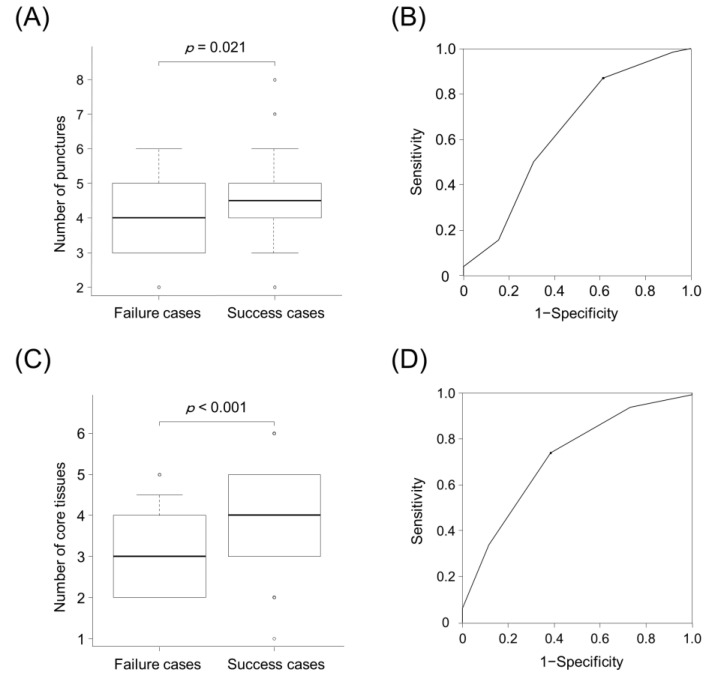
Figure 3.
Number of punctures and core tissues in failure and success cases of NGS (OncomineTM Dx Target Test) analysis using specimens obtained through EBUS-TBNA. (A) Success cases showed a higher number of punctures than failure cases (5 vs. 4, p = 0.021, Mann–Whitney U test). (B) ROC curve analysis yielded a cut-off value of 4 for the number of punctures. Using this cut-off value, the sensitivity and specificity of the number of punctures for predicting successful NGS were 38.5% and 86.9%, respectively. The area under the curve was 0.637 (95% confidence interval, 0.51–0.765). (C) Success cases showed a higher number of core tissues than failure cases (4 vs. 3, p < 0.001, Mann–Whitney U test). (D) ROC curve analysis yielded a cut-off value of four for the number of core tissues. With this cut-off value, the sensitivity and specificity of the number of core tissues for predicting successful NGS were 61.5% and 73.8%, respectively. The area under the curve was 0.718 (95% confidence interval, 0.613–0.823). In (A) and (C), the bottom and top of the boxes indicate the 25th and 75th percentiles, respectively. The middle line of the boxes indicates the median. The whiskers indicate the 10th and 90th percentiles, and cases lying beyond these range are marked as circle dots.

