Figure 1.
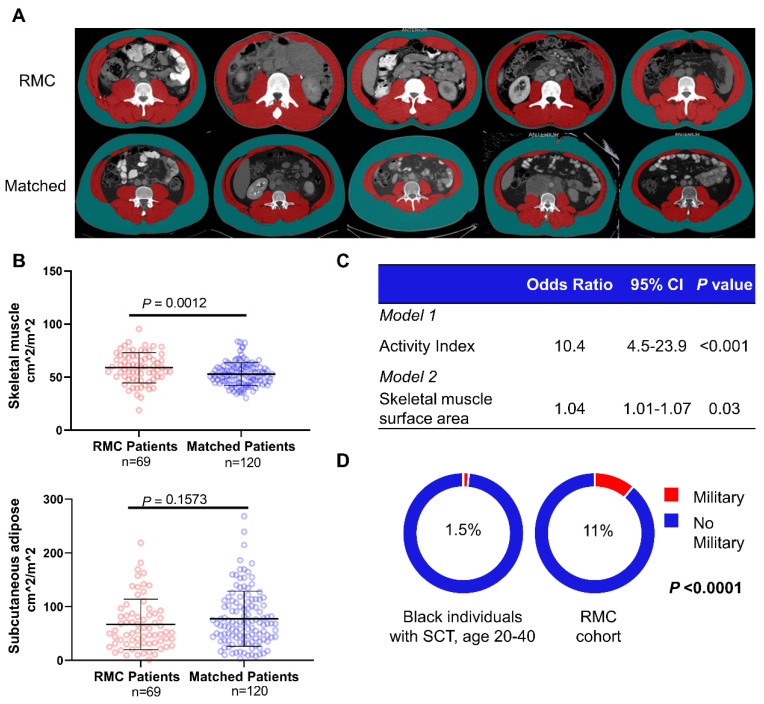
Clinical evaluation of physical activity for RMC and control patients. (A) Representative axial CT images from five RMC (top) and matched control (bottom) patients analyzed for skeletal muscle (SM) surface area (red) and subcutaneous adipose (green). (B) Dot plots of SM (top) and subcutaneous adipose (bottom) surface area. (C) Multivariable logistic regression models of the association between exercise history (model 1) or skeletal muscle surface area (model 2) and RMC. Additional results are provided in Supplementary Tables S4 and S5. (D) Estimated proportion of black individuals with SCT aged 20 to 40 years in the United States military (1.5%) compared to the proportion of similarly-aged black patients with SCT in the RMC cohort (11%).

