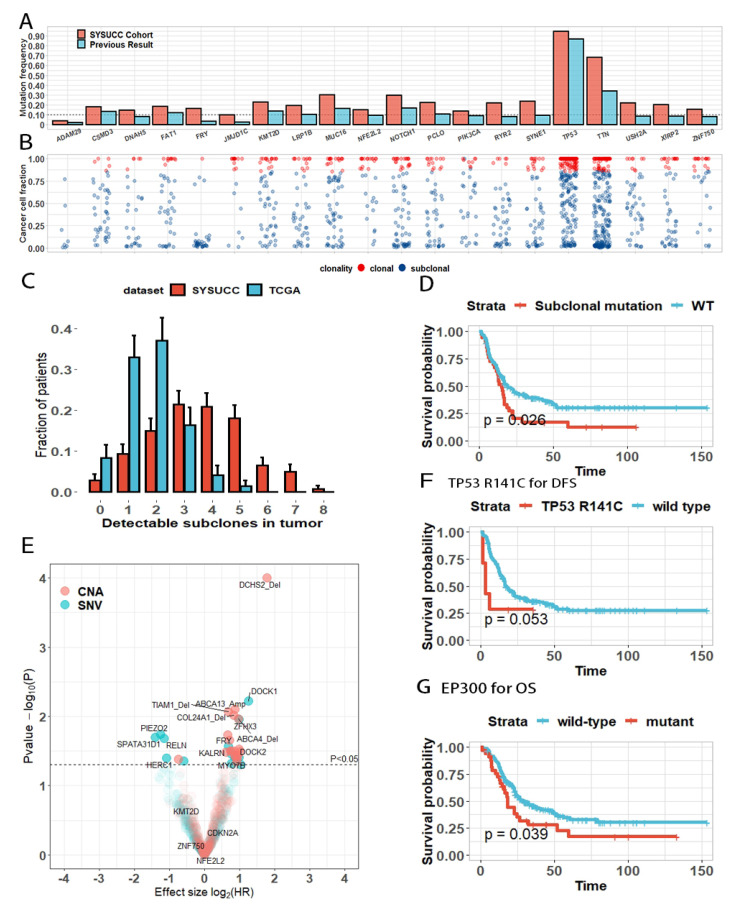
Figure 1.
Heterogeneity and clinical impact of alterations in ESCC. (A) Bar plot for comparison of mutation frequencies of the most frequently mutated genes observed in previous results and our cohort. (B) Scatter plot of cancer cell fraction of mutations in these frequently mutated genes. Clonal mutations are shown in red and subclonal mutations in blue. (C) Predicted number of subclones in ESCC. For comparison, the predicted number of subclones from patients in TCGA-ESCC cohort is also shown. Error bar represents the standard deviation. (D) Disease-free survival difference between patients with subclonal FRY mutations and wildtype FRY. (E) Volcano plot displays the relationship between genetic alterations and DFS. The X and Y axes indicate and , respectively. “Amp” and “Del” represent the amplification and deletion of the gene, respectively. (F) TP53 R141C hotspot mutation was associated with inferior DFS. (G) EP300 mutation was associated with grave OS.

