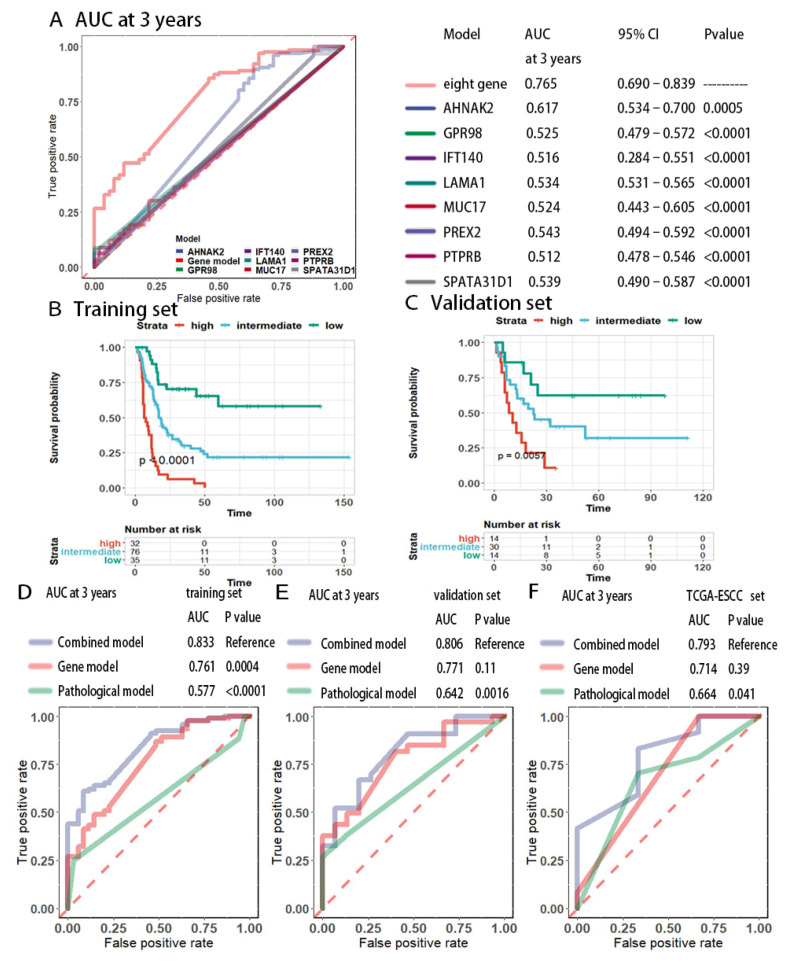
Figure 3.
Performance of the eight-gene model in the training and validation sets. (A) AUC of the time–dependent ROC curve for the eight–gene predictor and the individual genes across the entire cohort. (B,C) Patients stratified by risk scores had distinct DFS in the training set (B) and validation set (C). (D–F) Time–dependent ROC curves compared the prognostic accuracies of the combined model integrating the eight–gene signature and pathological staging with pathological staging in the (D) training cohort, (E) validation cohort and TCGA–ESCC cohort (F).

