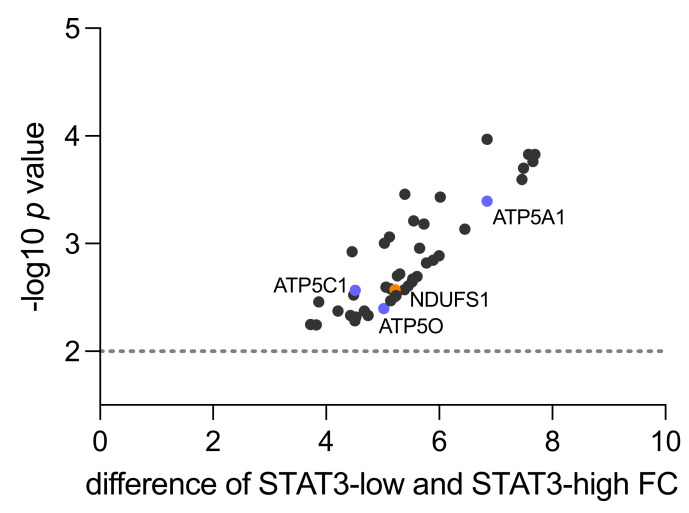
Figure 1.
Mitochondrial proteins upregulated in STAT3-low versus STAT3-high samples in proteomic shotgun analysis (n = 4). The y-axis shows the p value as −log10 and the x-axis indicates the difference in fold change (FC) between low vs. high STAT3 samples. Highlighted are NDUFS1 from complex I (orange) and ATP5O, ATP5A1 and ATP5C1 from complex V (blue). The dotted line represents level of 0.01 significance.

