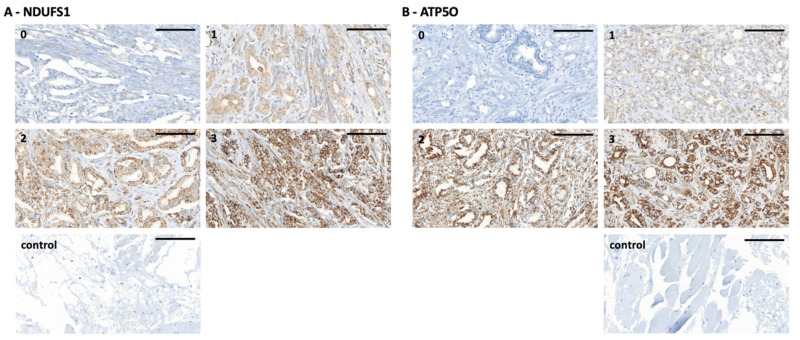
Figure 2.
(A) NDUFS1 immunohistochemistry staining of PCa tissue microarray (TMA) samples. (0) staining intensity of 0 to 0.5, (1) staining intensity of 1, (2) staining intensity of 2, (3) staining intensity of 3, (control) technical negative control staining (left). Scale bar = 100 µm. (B) ATP5O immunohistochemistry staining of PCa TMA samples. (0) staining intensity of 0 to 0.5, (1) staining intensity of 1, (2) staining intensity of 2, (3) staining intensity of 3, (control) technical negative control staining (right). Scale bar = 100 µm.

