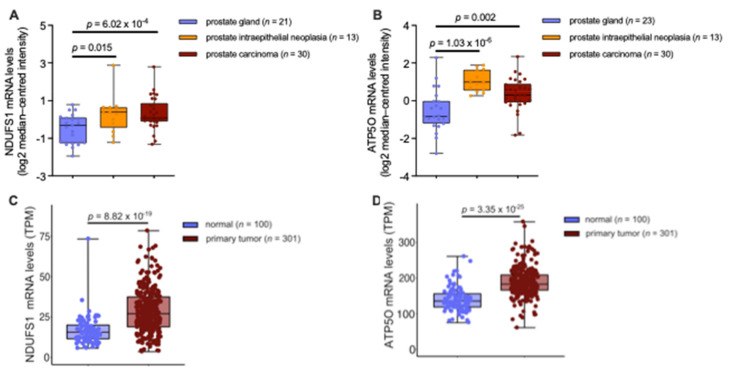
Figure 5.
(A) NDUFS1 mRNA expression levels analyzed from prostate carcinoma epithelia (n = 30; 1.74-fold increase), prostatic intraepithelial neoplasia epithelia (n = 13; 1.69-fold increase), or normal prostate gland samples (n = 21). (B) ATP5O mRNA expression levels analyzed from prostate carcinoma epithelia (n = 30; 1.83-fold increase), prostatic intraepithelial neoplasia epithelia (n = 13; 3.01-fold increase), or normal prostate gland samples (n = 23). (C) NDUFS1 mRNA expression levels (TPM) analyzed from TCGA-PRAD primary tumor tissue (n = 301) and true normal tissue samples (cancer-free patients) from GTEx (n = 100). (D) ATP5O mRNA expression levels (TPM) analyzed from TCGA-PRAD primary tumor tissue (n = 301) and true normal tissue samples (cancer-free patients) from GTEx (n = 100). Data for (A,B) were extracted from the Oncomine™ Platform from the Tomlins Prostate dataset. Data for (C–D) were extracted from The Cancer Genome Atlas-Prostate Adenocarcinoma data collection and the Genotype-Tissue Expression project. Representation: boxes as interquartile range, horizontal line as the mean, whiskers as lower and upper limits.

