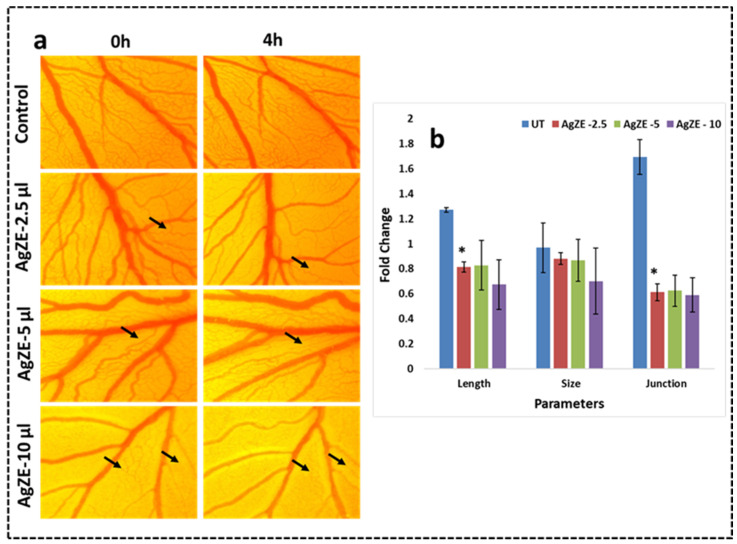
Figure 9.
Chick embryo angiogenesis assay (a) Column I: 0 h; Column II: 4 h; Row I: Control (untreated); Row II: AgZE-2.5 µL; Row III: AgZE-5 µL; and Row IV: AgZE-10 µL. AgZE inhibits the growth of blood vessels that indicate the probable anticancer nature of the nanoparticles. (b) The images are quantified with respect to length, junction, and size using Angioquant software. The black arrows indicate the change in blood vessels of the AgZE treatment groups at 0 h and 4 h time points. These experiments are performed thrice and represented as the mean ± SD. Significant differences from UT embryo are observed (* p < 0.05).

