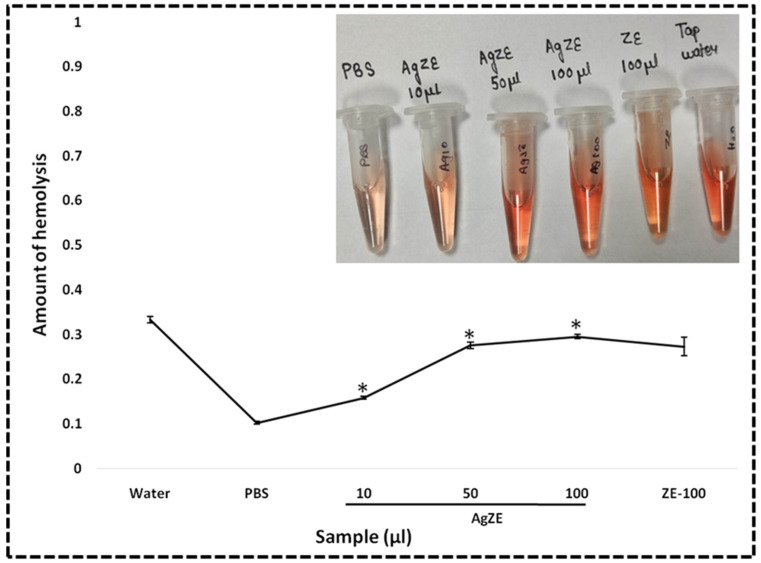
Figure 11.
Hemolytic assay in vivo using mice blood indicating the hemocompatible nature of the AgZE (5–100 µL). The inset picture represents the amount of hemolysis (with respect to red color intensity) is more in positive control (tap water) compared to other treatments, whereas no hemolysis is observed in negative control (PBS). Numerical values indicate the AgZE pellet amount taken where 1 µL = 0.23 µg/mL of silver as per ICPOES study. These experiments are performed thrice and represented as the mean ± SD. Significant differences from negative control are observed (* p < 0.05).

