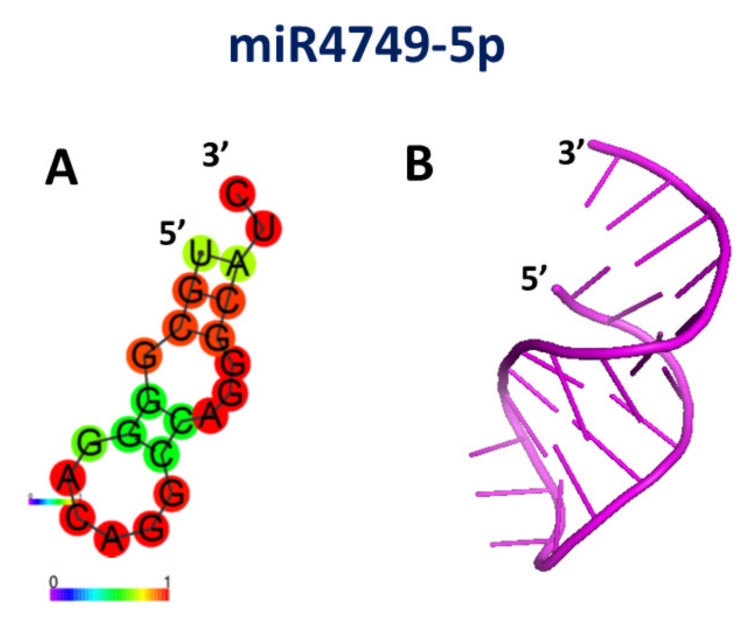
Figure 3.
(A) Drawing of the best model for the secondary structure of miR4749-5p; colors of the spots indicate the corresponding pair-base probability (see the scale at the bottom). (B) Graphical representation of the best 3D model for the tertiary structure of miR4749-5p, as derived using the secondary structure in (A) together with related dot-bracket notation. Adapted from ref. [70].

