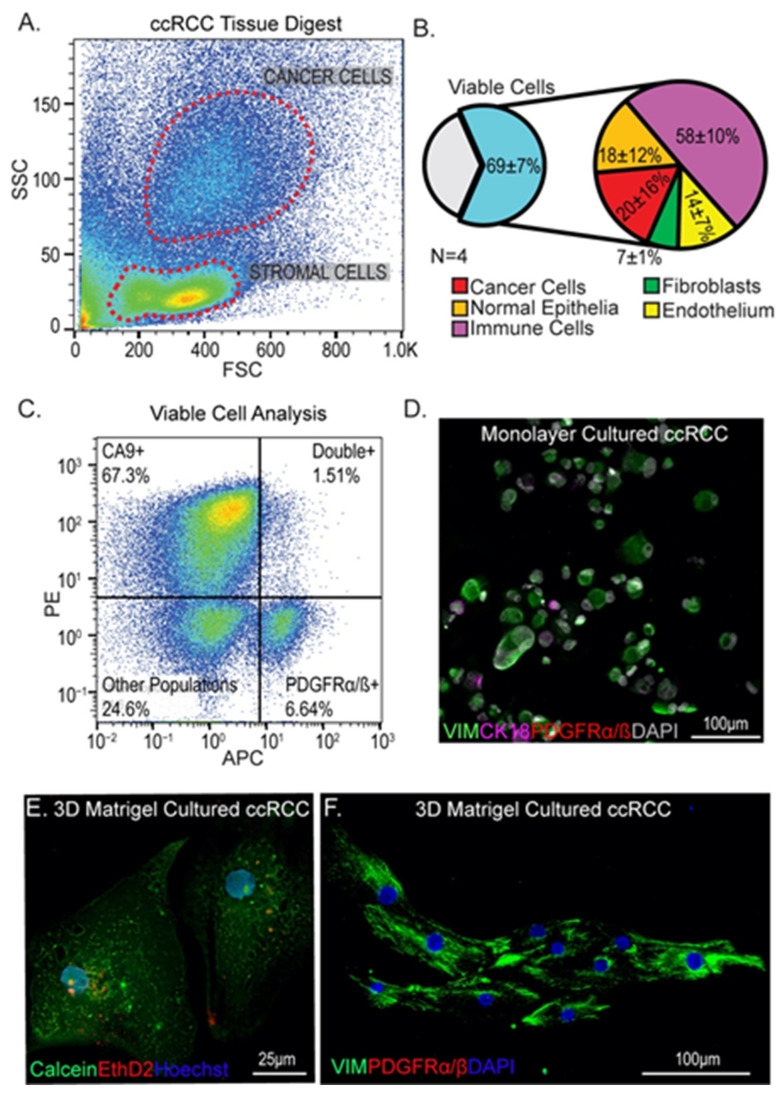
Figure 1.
Identification and culture of fibroblasts from ccRCC tumors. (A) Representative flow cytometry cell marker analysis of ccRCC tumors can allow distinction of stromal populations (low-side scatter) from cancer cells (high side scatter). (B) Summary of marker analysis of different cell types from four different patient tumors. Viability determined by propidium iodide exclusion. (C) Identification of fibroblasts using PDGFRα/β, showing distinction from CA9+ tumor cells. (D) Standard monolayer culture of isolated tumor cells showing lack of PDGFRα/β+ stromal cells. Green = vimentin, magenta = CK18, red = PDGFRα/β, gray = DAPI. (E,F) Subsets of cells from primary tumor digests are viable when cultured in Matrigel domes (E) but no evidence of PDGFRα/β + stromal cells could be found (F). Green = vimentin, red = PDGFRα/β, blue = DAPI.

