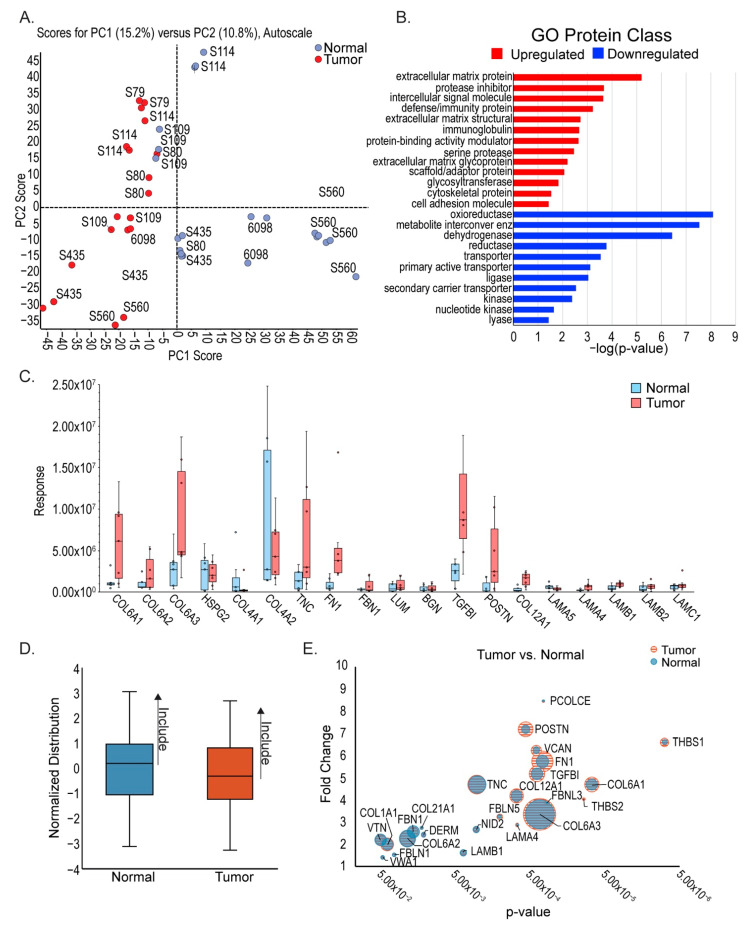
Figure 2.
ECM protein upregulation in ccRCC. (A) Principal component analysis of mass spectrometry data from stage 3 ccRCC tumors and matched adjacent healthy cortex shows separation between tumor and normal. (B) Gene Ontology (GO) analysis of identified proteins shows highest upregulation of the protein class PC00102: extracellular matrix protein. (C) Analysis of highest upregulated and downregulated ECM proteins identified by mass spectrometry data and cross-referenced with the Matrisome database (MatrisomedDB). (D) Summary of DDA mass spectrometry analysis, indicating inclusion of only the most abundant ECM proteins. (E) Combined SWATH and DDA analyses to visually represent most significant ECM protein changes between tumor and adjacent normal kidney.

