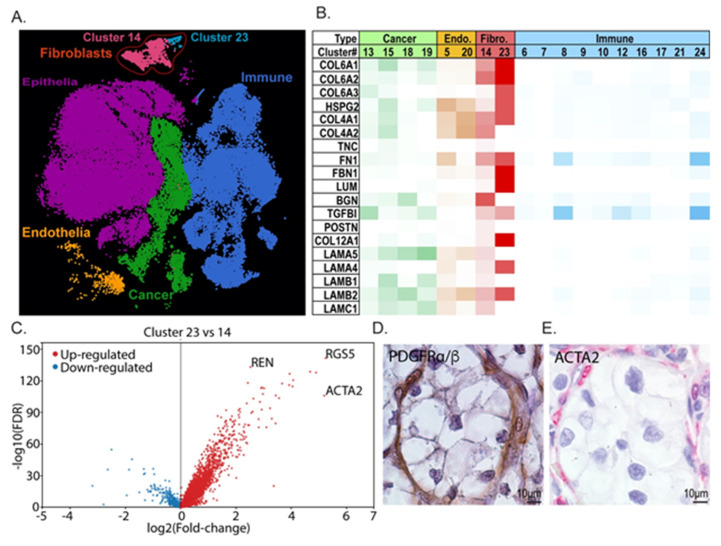
Figure 3.
Prediction of cellular sources of matrix molecules based on scRNA-seq. (A) scRNA-seq analysis of ccRCC tumors from Young et al. [33]. Unbiased clustering was performed, and clusters were identified using cell-type-representative transcripts. Distinct fibroblast subclusters are indicated and outlined in red. (B) Differential ECM gene expression analysis of clusters identified as discrete cell populations. Endo. = endothelial cells, Fibro. = fibroblast cells. (C) Comparative transcript analysis between fibroblast sub-clusters 23 and 14 shows differential expression of cancer associated fibroblast markers. (D,E) Representative IHC from patient ccRCCs for PDGFRα/β+ (D).

