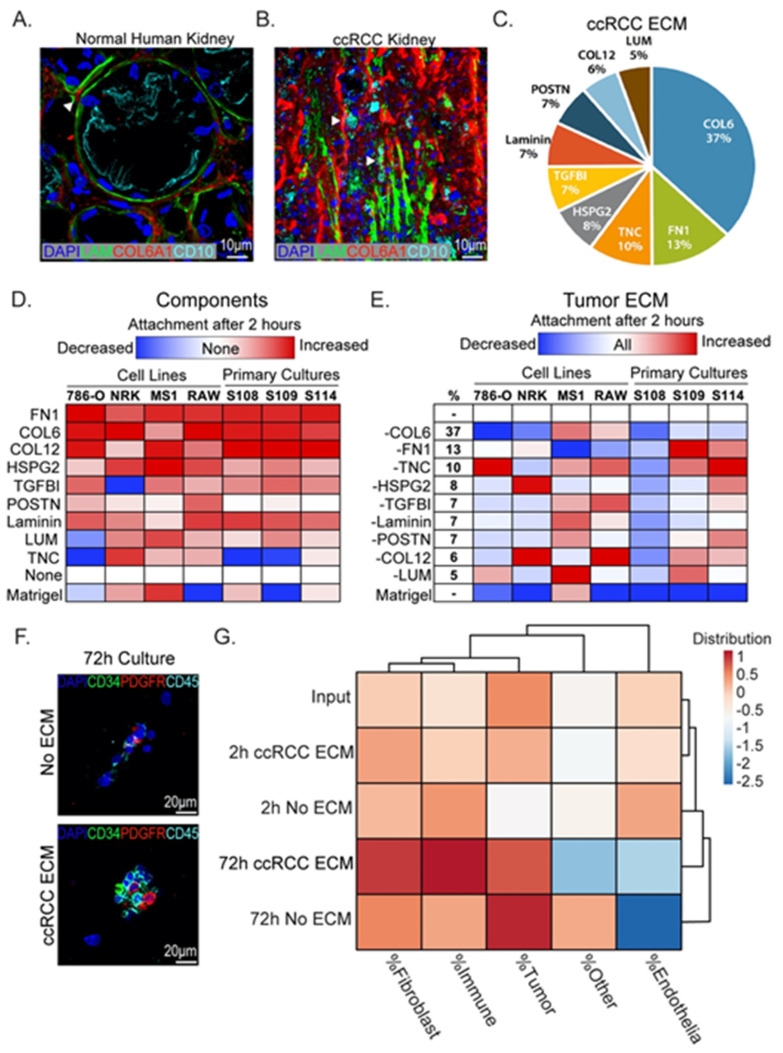
Figure 4.
ECM effects on tumor and stromal cell attachment. (A) Immunofluorescence staining of healthy human kidney showing structured tubule basement membrane separating CD10+ proximal tubule epithelium from interstitial collagens (white arrowheads). Blue = DAPI, green = laminin, Red = collagen 6 alpha 1, cyan = CD10. (B) Immunofluorescence staining of ccRCC tumor for ECM components showing loss of the tubule basement membrane and mixing of laminin and interstitial collagens (white arrowheads). Blue = DAPI, green = laminin, red = collagen 6 alpha 1, cyan = CD10. (C) Pie chart summarizing major components of ccRCC ECM from mass spectrometry analysis. (D) Analysis of attachment of cell cultures to ECM components identified by mass spectrometry. Cell attachment to 2 µg/mL of indicated ECM-coated wells was determined after 2 h. Heatmap indicates increased cell attachment (red) and decreased attachment (blue) relative to no coating condition (“None”). (E) Cell attachment to coated dishes in the presence of all proteins or lacking one component, indicated by “-” sign. Analysis was done relative to complete blend condition “All”. Total percentage each individual component takes up in the total blend (2 µg/mL total protein) is indicated in the “%” column. (F) Freshly digested tumor tissue 72 h after plating on ccRCC ECM or noncoated plates. Scale bar = 20 µm. Blue = DAPI, green = CD34, red = PDGFRα/β, cyan = CD45. (G) Cluster analysis comparing cultures grown on coated or uncoated chamber slides to initial cell input.

