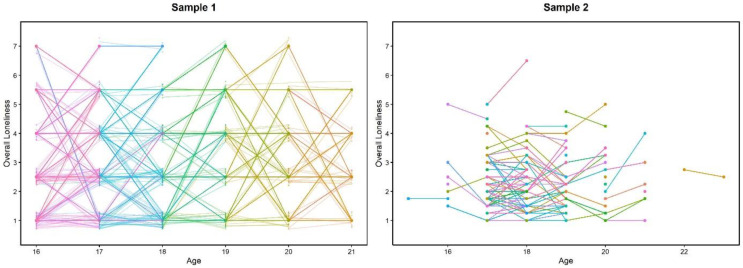
Figure A1.
Individual changes of loneliness between T1 and T2 plotted over age. The colored dots and lines represent individual scores of overall loneliness. In Sample 1, loneliness was assessed with a one-item measure and the plot is based on data of N = 283 adolescents who participated at T1 and T2. To avoid overplotting and to illustrate the distribution of values within this sample, we added transparent dots and lines, which represent the true values plus noise. In Sample 2, overall loneliness was computed from the average of four items, and the plot is based on data of N = 129 adolescents who participated at T1 and T2. Please note that whereas loneliness is plotted over age for illustrative purposes, statistical models were estimated over measurement points of the study.

